Question 1
Consider the following graphic illustrating a method supporting the TOGAF ADM.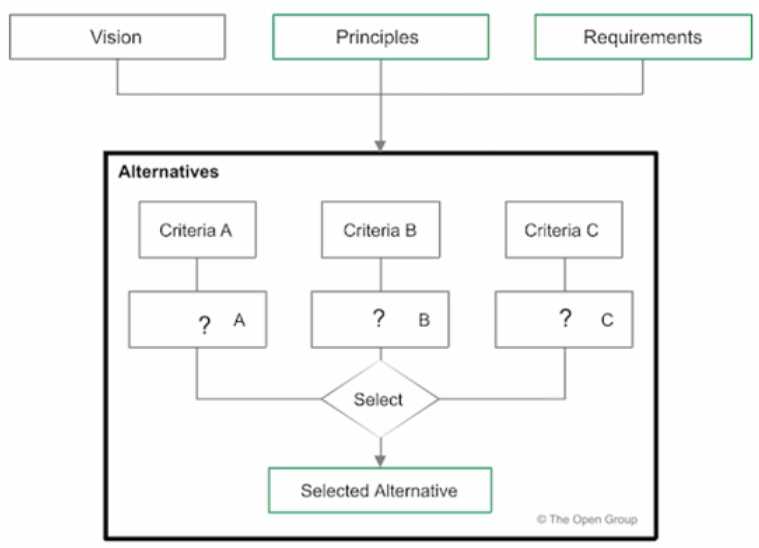
What does the method help identify?
- A. Solution Building Blocks
- B. Business Scenarios
- C. Alternative Target Architectures
- D. Architecture Solutions
Answer:
C
Explanation:
The graphic illustrates a method for developing alternative target architectures in Phase E of the
TOGAF ADM1
.
The method involves identifying and evaluating candidate architectures based on
criteria such as business value, cost, risk, and feasibility1
. The method helps to identify the most
suitable architecture solution for the enterprise.
https://pubs.opengroup.org/togaf-standard/adm-techniques/chap10.html
The graphic illustrates a method that supports the TOGAF ADM by identifying and evaluating
alternative target architectures. The process begins with a vision, influenced by principles and
requirements, leading to the consideration of alternatives. Each alternative is assessed based on
different criteria, leading to the selection of the most suitable target architecture. This is consistent
with the TOGAF approach of developing a set of potential architectures and then selecting the one
that best meets the enterprise's needs.
Comments
Question 2
Consider the following modeling example, relating business capabilities to organization units so as to
highlight duplication and redundancy: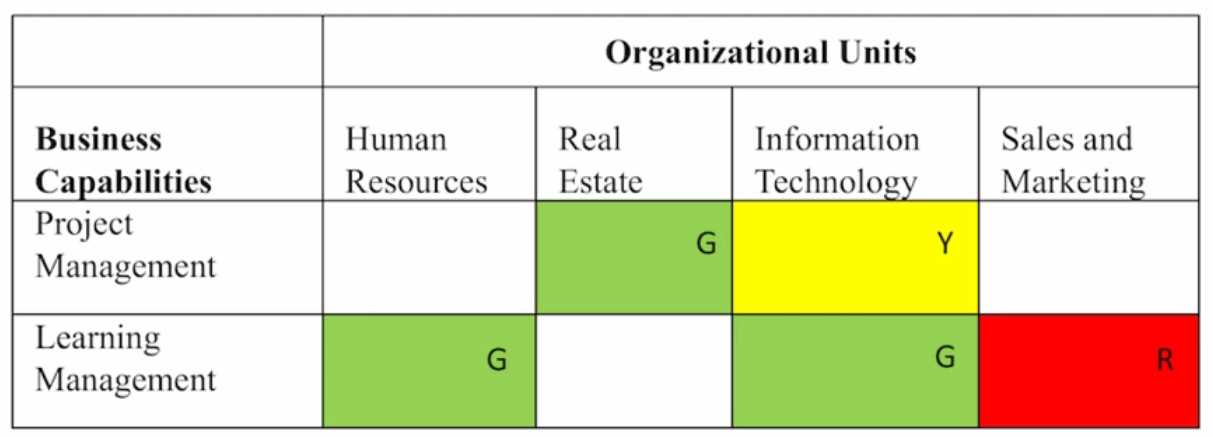
(Note in this example the cells colored green, yellow, and red, are also marked G. Y, and R,
respectively) Which of the following best describes this technique?
- A. Relationship Mapping
- B. Capability Mapping
- C. Perspective Analysis
- D. Gap Analysis
Answer:
A
Explanation:
The technique shown in the example is called relationship mapping.
It is a technique that can be
used to show how a business architecture addresses stakeholder concerns across different parts of
an organization2
. It can highlight gaps or overlaps in the coverage of stakeholder concerns by a
business architecture. In this case, the technique is used to relate business capabilities to
organization units so as to highlight duplication and redundancy.
This modeling technique is referred to as Relationship Mapping. It's used to relate business
capabilities to organizational units to highlight areas of duplication and redundancy, as well as to
indicate where capabilities are being performed well (green), where there are potential issues
(yellow), and where there are significant problems or gaps (red). This visualization helps in
understanding the alignment between organizational units and capabilities, and where
improvements or changes may be needed.
5.2.1 Capability/Organization Mapping
https://pubs.opengroup.org/togaf-standard/business-architecture/business-capabilities.html#_Toc95135898
Comments
Question 3
Which approach to model, measure, and analyze business value is primarily concerned with
identifying the participants involved in creating and delivering value?
- A. Value chains
- B. Value networks
- C. Lean value streams
- D. Value streams
Answer:
B
Explanation:
Value networks are an approach to model, measure, and analyze business value that is primarily
concerned with identifying the participants involved in creating and delivering value3
.
Value
networks focus on the relationships and interactions among the participants, such as customers,
suppliers, partners, employees, and other stakeholders3
. Value networks can help to understand
how value flows through the network and how it can be improved or optimized.
Value networks emphasize the interconnectedness of various entities involved in creating and
delivering value. This approach goes beyond the linear view of a value chain and recognizes the
complex relationships and interactions between:
Internal participants: Different departments, teams, and individuals within the organization.
External participants: Suppliers, partners, customers, and other stakeholders outside the
organization.
By identifying and analyzing these participants, value networks help to:
Understand the ecosystem: Gain a holistic view of how value is created and delivered within a
broader network of relationships.
Identify key dependencies: Recognize how different participants rely on each other and how their
actions affect the overall value creation process.
Optimize collaboration: Improve coordination and collaboration between participants to enhance
efficiency and value delivery.
Identify potential risks and opportunities: Assess the impact of changes or disruptions within the
network on value creation
Comments
Question 4
Which of the following describes how business models are used within the TOGAF standard?
- A. To identify, classify, and mitigate risks to the business.
- B. To tailor the enterprise architecture for the business.
- C. To document the factors impacting the business migration plan.
- D. To help formulate architecture and business principles.
Answer:
D
Explanation:
Business models play a significant role in shaping the principles that guide both architecture
development and business operations within the TOGAF framework. Here's how:
Understanding value creation: Business models articulate how an organization creates, delivers, and
captures value. This understanding informs the development of architecture principles that support
and enable value creation.
Aligning architecture with business goals: By analyzing the business model, architects can identify
the key drivers and priorities of the business. This helps to formulate architecture principles that
ensure the architecture aligns with the business goals and strategy.
Defining desired behaviors: Business models often implicitly or explicitly define desired behaviors
and ways of working within an organization. These behaviors can be codified into business principles
that guide decision-making and actions across the enterprise.
Promoting consistency: Using the business model as a foundation for principles ensures consistency
between the architecture and the business strategy. This helps to avoid conflicts and ensures that the
architecture supports the overall direction of the organization.
Comments
Question 5
Which of the following can be used to help define information concepts in an information map?
- A. Stakeholder Map
- B. Value streams
- C. Statement of business goals and drivers
- D. Organization Map
Answer:
A
Explanation:
Role of Information Maps in TOGAF
Information maps are used to define and structure the key information concepts necessary for an
organization’s operations. They organize information in a way that aligns with the organization’s
business needs and are crucial for creating a robust information architecture.
Relationship Between Information Maps and Stakeholder Maps
In TOGAF and enterprise architecture practices, stakeholder maps play an essential role in defining
information concepts because they identify the various stakeholders involved in or affected by the
business operations. Understanding stakeholders and their interactions helps architects determine
the types of information that are valuable to each stakeholder group. This understanding aids in
structuring the information map to meet the specific needs and requirements of each stakeholder.
As per TOGAF guidance, if an organization already has a stakeholder map, it can serve as a valuable
tool for identifying the information concepts required by different stakeholders. This allows
architects to tailor the information architecture to align with the interests, roles, and responsibilities
of stakeholders, which directly impacts the organization’s information needs.
Why Stakeholder Map is the Correct Answer
Stakeholder maps provide insights into the information needs of various stakeholders, helping to
define information concepts within the information map.
By referencing a stakeholder map, architects can identify the key information flows, data
requirements, and access needs of each stakeholder, ensuring that the information map is
comprehensive and aligned with actual usage.
This alignment with stakeholder needs ensures that the information architecture supports the
organization’s objectives by delivering relevant information to each party involved.
Why Other Options are Less Suitable:
Option B (Value Streams):
Value streams focus on the high-level flow of activities that deliver value but do not directly inform
the structure of information concepts.
Option C (Statement of Business Goals and Drivers):
While business goals and drivers provide strategic direction, they do not specifically define
information concepts in the same way that understanding stakeholder needs does.
Option D (Organization Map):
An organization map helps in understanding roles and responsibilities within the enterprise but does
not directly influence the definition of information concepts in the same manner as a stakeholder
map.
Conclusion:
The correct answer is A. Stakeholder Map because it directly helps define information concepts in an
information map by clarifying the information needs of each stakeholder group.
Reference:
TOGAF® Standard, Version 9.2, Stakeholder Mapping and Information Mapping Techniques
TOGAF Business Architecture Guide, sections on Information Maps and Stakeholder Maps
Comments
Question 6
Complete the sentence. A business model is a description of the rationale for how an organization
creates, delivers, and captures
- A. strategy
- B. business function
- C. best practices
- D. value
Answer:
D
Explanation:
A business model is a description of the rationale for how an organization creates, delivers, and
captures value4
.
Value is defined as the worth or importance of something to someone6
.
A business
model explains what value proposition the organization offers to its customers, what revenue
streams it generates from delivering the value proposition, what cost structure it incurs to create and
deliver the value proposition, what key resources and activities are needed to create and deliver the
value proposition, and what key partnerships are leveraged to support the value creation and
delivery process4
.
Comments
Question 7
Which of the following Business Architecture concepts should the architect examine and search for
when developing the Architecture Vision?
- A. Architecture Principles, Business Goals
- B. Implementation Factor Catalog. Business Value Assessment Matrix
- C. Architecture Continuum, Architecture Repository
- D. Organization Map. Business Capabilities
Answer:
D
Explanation:
In developing an Architecture Vision within TOGAF, the architect should examine and search for
foundational Business Architecture concepts to ensure that the enterprise architecture is aligned
with the organization’s strategy and delivers value to stakeholders. Here’s a detailed breakdown of
the relevant Business Architecture concepts that need to be examined in this context:
Business Capabilities
Business Capabilities represent the core abilities or capacities of an organization that allow it to
achieve specific purposes or outcomes. In TOGAF, identifying and analyzing Business Capabilities
helps architects understand the organization’s functional strengths and gaps. This examination
provides insight into which capabilities are critical for achieving strategic goals and how they may
need to evolve to support the target architecture.
Value Streams
Value Streams depict the end-to-end processes that deliver value to customers, stakeholders, or end
users. By identifying Value Streams, the architect can understand how value is created and delivered,
ensuring that architecture decisions support these value-generating processes. Value Streams in
TOGAF are integral to identifying areas where improvements, efficiencies, or innovations can be
applied, enhancing the organization’s ability to meet its strategic objectives.
Organization Maps
Organization Maps outline the relationships between various entities within the enterprise, including
internal departments, partners, and stakeholders. These maps provide a structural overview,
showing the formal and informal relationships that influence how work is conducted across the
organization. In the Architecture Vision phase, Organization Maps help architects understand
organizational dependencies, stakeholder concerns, and potential alignment issues between
business units.
Application in the Architecture Vision Phase:
By examining these concepts—Business Capabilities, Value Streams, and Organization Maps—the
architect can gain a comprehensive understanding of the current state of the business and how it is
structured to deliver value. This analysis is essential for setting a realistic and strategically aligned
vision that addresses core business needs and prepares the organization for future growth and
transformation.
TOGAF Reference:
TOGAF Standard, Architecture Vision Phase
TOGAF Business Architecture guidelines on Business Capabilities, Value Streams, and Organization
Mapping
Comments
Question 8
Consider the following business capability map. where cells of a model are given different colors to
represent maturity levels (note the letters G, R. Y. P also denote the colors used = Green, Red. Yellow
and Purple):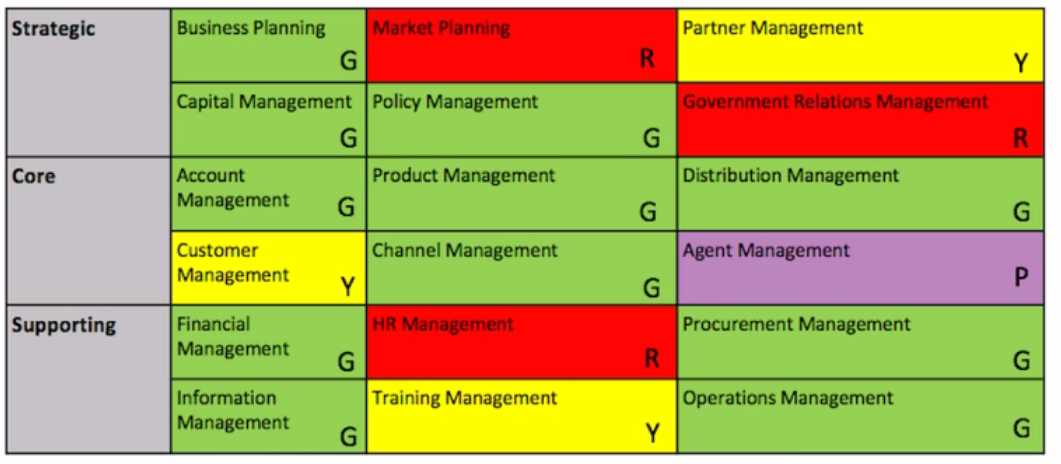
Which of the following best describes this technique?
- A. Heat Mapping
- B. Perspective Analysis
- C. Gap Analysis
- D. Capability Mapping
Answer:
A
Explanation:
The technique shown in the example is called heat mapping.
It is a technique that can be used to
show a range of different perspectives on a business capability map, such as maturity, effectiveness,
performance, and value or cost contribution of each capability to the business2
. Different attributes
determine the colors of each capability on the business capability map. Heat mapping can help to
identify strengths, weaknesses, opportunities, and threats in the business architecture.
https://governance.foundation/assets/frameworks/togaf/g189%20-%20Business%20Capbility.pdf
Table 3: Heat Map for ABC Company’s Business Capabilities
Comments
Question 9
Consider the diagram.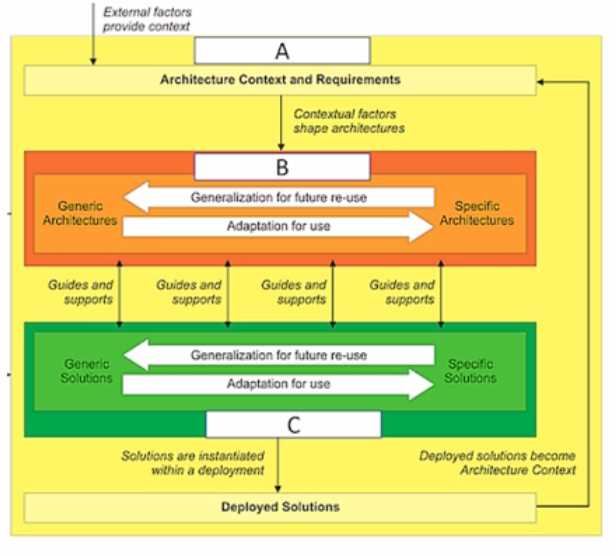
What are the items labelled A, B and C?
- A. A-Enterprise Strategic Architecture, B-Segment Architecture, C-Solutions Architecture
- B. A-Enterprise Continuum, B-Architecture Continuum. C-Solutions Continuum
- C. A-Architecture Vision, B-Business Architecture. C-lnformation Systems Architecture
- D. A-Enterprise Architecture, B-Architecture Building Blocks, C-Solutions Building Blocks
Answer:
B
Explanation:
The diagram shows the Enterprise Continuum, which is a view of the Architecture Repository that
provides methods for classifying architecture and solution artifacts as they evolve from generic
Foundation Architectures to Organization-Specific Architectures4
. The Enterprise Continuum
comprises two complementary concepts: the Architecture Continuum and the Solutions
Continuum.
The Architecture Continuum shows the relationships among foundational frameworks,
common system architectures, industry architectures, and enterprise architectures4
.
The Solutions
Continuum shows the relationships among foundational solutions, common system solutions,
industry solutions, and enterprise solutions4
.
Comments
Question 10
Refer to the table below: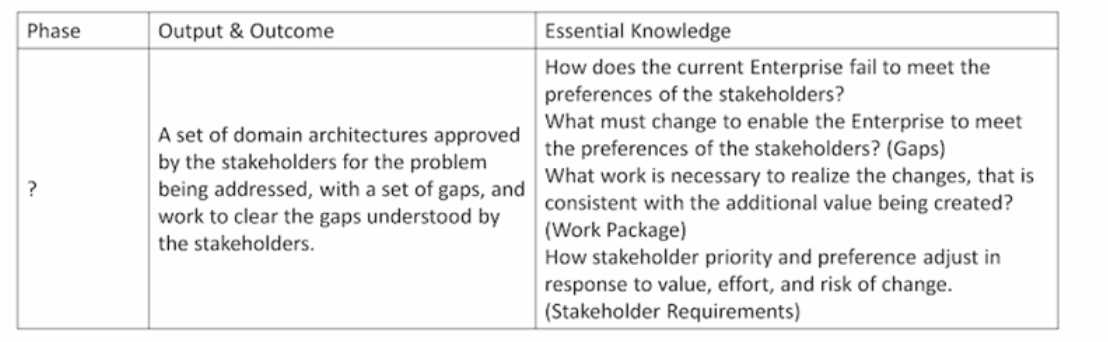
Which ADM Phase(s) does this describe?
- A. Preliminary Phase
- B. Phase B
- C. Phase B. C and D
- D. Phase E
Answer:
C
Explanation:
The table describes the steps involved in Phase B (Business Architecture), Phase C (Information
Systems Architectures), and Phase D (Technology Architecture) of the TOGAF ADM5
. These phases
are responsible for developing the target architectures for each domain and identifying the gaps
between the baseline and target architectures. The table shows the outputs and outcomes of each
phase, as well as the essential knowledge required for each phase.
The table describes the iterative cycle of defining requirements, identifying gaps, and creating
solutions that occurs throughout the architecture development phases of the TOGAF ADM. This cycle
is most prominent in:
Phase B (Business Architecture):
Develop the Business Architecture, identifying gaps between the baseline and desired business
capabilities, processes, and information flows.
Define work packages to address these gaps and realize the target business architecture.
Phase C (Information Systems Architectures):
Develop the Data and Application Architectures to support the Business Architecture.
Identify gaps between the baseline and target information systems architectures.
Define work packages to address these gaps and realize the target data and application architectures.
Phase D (Technology Architecture):
Develop the Technology Architecture to support the Data and Application Architectures.
Identify gaps between the baseline and target technology architectures.
Define work packages to address these gaps and realize the target technology architecture.
Comments
Page 1 out of 10
Viewing questions 1-10 out of 110
page 2