oracle 1z0-1066-21 practice test
Oracle Planning and Collaboration Cloud 2021 Implementation Essentials Exam
Last exam update: Jun 23 ,2025
Question 1
Where do you view the collected data for Organizations, Customers, Suppliers, Carriers, and
Interlocation Shipping Networks?
- A. View Simulation Sets
- B. Review Plan Inputs
- C. Maintain Supply Network Model
- D. View Collected Data
- E. Planning Analytics
Answer:
C
Question 2
Your client wants their supply plans to have a customized group of exceptions. What two steps must
you complete in order to make sure only these exceptions are included when running all of your
clients supply plans? (Choose two.)
- A. Manage Plans > Select each supply plan > Edit each supply plan > Manually add each exception specified by client
- B. Configure Exceptions > Expand Supply Planning Exceptions > Highlight lines with exceptions specified by client > Click 'Add to Exception Set'
- C. Configure Exception Sets > Create exception set > Add exceptions specified by client
- D. Select 'Add to Supply Plan' button > Select which supply plans you want to have this group of exceptions
- E. Manage Plans > Select each supply plan > Edit each supply plan > Add your exception set to Plan Options for each supply plan
Answer:
CE
Question 3
On the plan page layout that you created, you have several graphs showing the status of the plans
and the business. You see a concern in an area and you want to see the data behind it. What
navigation should you use to see this data?
- A. You cannot see it from the plan landing page, and you will need to search for the data.
- B. On the table in question, go to View > Show table.
- C. You cannot see it on the plan outputs, and you will need to create a new table with the information.
- D. Go to Actions > View Data on the graph in question.
- E. You cannot see it on the plan outputs, so you need to go into Planning Analytics and re-search the data.
Answer:
A
Question 4
Your customer has seasonal demand and wants to generate forecast for next six months. You ran a
demand plan for first time using six months of shipments history but the forecast accuracy was low.
Identify two statements that are true in this scenario. (Choose two.)
- A. Running a demand plan with both shipments and booking forecast profile is required to forecast seasonal demand.
- B. Running a demand plan with less than one year of history will impact seasonal analysis.
- C. Running a demand plan with both shipments and seasonal shipments forecast profile is required to forecast seasonal demand.
- D. Running a demand plan with six months of booking history instead of six months of shipment history is required for seasonal demand.
- E. Running a demand plan with 18 to 36 months of shipments history is recommended.
Answer:
D,E
Question 5
Which calendar is supported in the supply planning process but does not support bucketing by
week?
- A. Lunisolar
- B. Fiscal
- C. Roman
- D. Gregorian
- E. Julian
Answer:
E
Explanation: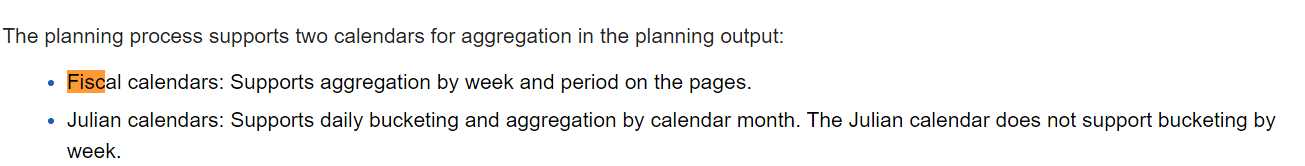
Question 6
Your client uses product categories and global sourcing rules for supply planning. However, their
newest product doesn't follow these rules. For a specific item in the category, it needs to be sourced
from a different supplier globally.
How should they set this up for the easiest maintenance, going forward?
- A. Create a new global sourcing rule for the item; remove the category level assignments and create new item level assignments for all items in the category pointing each to the correct global sourcing rule.
- B. Create a new local sourcing rule for the item; assign it to the assignment set at the item level; leave the category as is for the remainder of the products.
- C. Create a new global sourcing rule for the item; assign it to the assignment set at the item- organization level; leave the category as is for the remainder of the products.
- D. Create a new global sourcing rule for the item; assign it to the assignment set at the item level; leave the category as is for the remainder of the products.
- E. Create a new global sourcing rule for the item; assign it to the assignment set at the item- organization level; alter the category to be category-organization for the remainder of the products.
Answer:
D
Question 7
Which four types of items are eligible to be included as Supply Planned Items in the Supply Plan?
(Choose four.)
- A. Demand plan items
- B. WIP components
- C. All planned items
- D. Purchased Items
- E. Supply plan items
- F. All sales orders
Answer:
A,B,C,F
Question 8
You want to understand what your inventory turns are for your organization. Where can you see this
information in Planning Central?
- A. Manage Planning Analytics
- B. Manage Planning Measures
- C. View Planning Analytics
- D. Manage Metrics
- E. Plan Summary
Answer:
E
Question 9
You ran a demand plan and you are reviewing the shipments forecast value measure. It is always zero
for a particular item. Identify the root cause of this problem.
- A. In planning measures catalog, shipment forecast value measure is not enabled at item and organization level.
- B. In plan parameters, Item List Price marked as primary does not have price defined for the particular item.
- C. In plan parameters, shipment forecast value measure expression is not defined.
- D. In planning measures catalog, shipment forecast measure is not enabled at item and organization level.
Answer:
A
Question 10
You want to check how many items have excess inventory. Where must you go in Planning Central to
find this information?
- A. Open Table, Graph, or Tile Set > Search Exceptions > Open > Expand Supply Planning Exceptions > Select Item with Excess Inventory
- B. Manage Plans > Edit Demand and Supply Plan > Select Supply tab > Navigate to Item area > Filter by Items with Excess Inventory
- C. Manage Plans > Edit Supply Plan > Select Supply tab > Navigate to Item area > Filter by Items with Excess Inventory
- D. Configure Exceptions > Expand Supply Planning Exceptions > Select Item With Excess Inventory
- E. Configure Exceptions > Expand Demand Planning Exceptions > Select Item With Excess Inventory
Answer:
A
Explanation: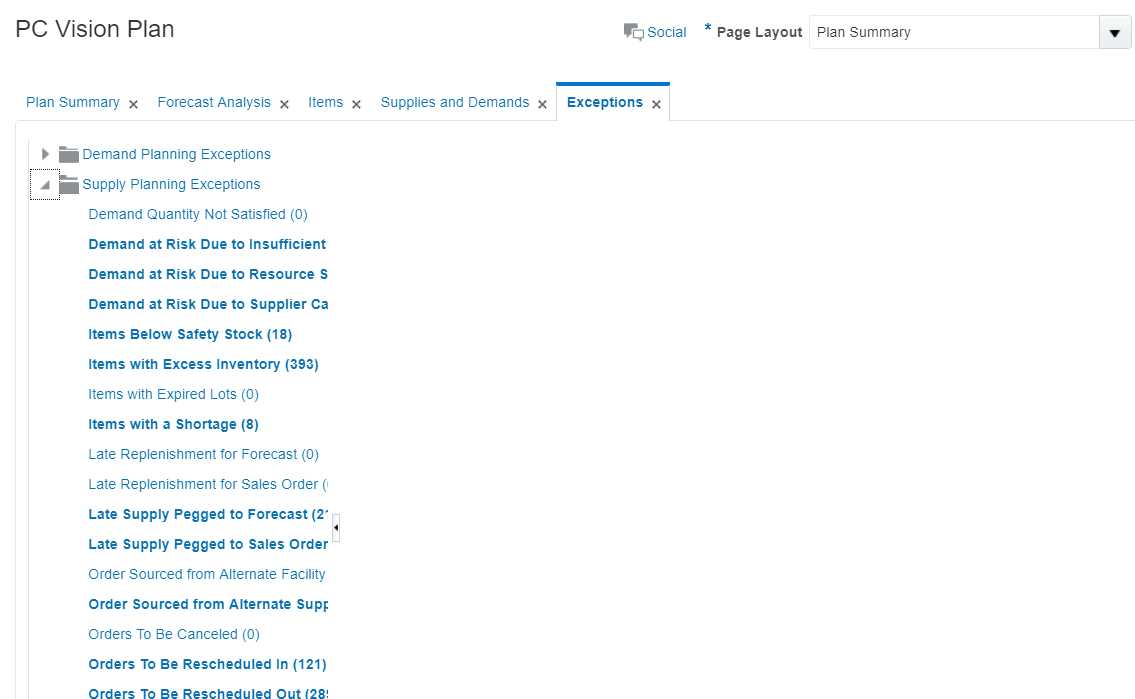
Question 11
A customer would like to account for the production loss in the supply planning process using the
item shrinkage rate planning specification.
Which statement reflects the system behavior to meet this requirement?
- A. Planning process reduces the demand based on shrinkage factor and keeps the supply quantity as is.
- B. Planning calculation does not support shrinkage functionality.
- C. Planning calculates no additional demand but creates the additional required supply based on shrinkage factor.
- D. Planning calculation creates scrap demand to compensate for loss and maintains supply.
Answer:
D
Question 12
Which release recommendation parameter can you utilize to govern the behavior of the auto-release
process?
- A. Release Only by User
- B. Auto-Release Interval in Days
- C. Auto-Release Planned Order Time Fence
- D. Quick Release Time Fence
- E. Compression Days Tolerance for Automatic Release
Answer:
D
Question 13
Which two statements are true regarding Planning Business Flows? (Choose two.)
- A. Inventory Planning cannot run in the Planning Business Flows.
- B. You can analyze and adjust data at any stage of the process.
- C. In automated plans, all release rules must be automatic.
- D. Demand and Supply Planning have to be run in separate business flows.
- E. Planners can set up automatic release rules or release orders manually as part of the plan execution.
Answer:
B,E
Question 14
Your client wants to create a supply plan that only considers sales order and disregards forecast
demand within a specific demand horizon. What must you do to accomplish this?
- A. Manage Plans > Search and select supply plan > Supply tab > Organizations and Schedules tab > Remove all demand schedules
- B. Manage Plans > Search and select demand plan > Demand tab > General tab > Select 'Do no spread forecast'
- C. Manage Plans > Search and select demand plan > Demand tab > General tab > Check Demand Time Fence Control
- D. Manage Plans > Search and select supply plan > Supply tab > General tab > Advanced Options > Check 'Create time fence'
- E. Manage Plans > Search and select supply plan > Supply tab > General tab > Check Demand Time Fence Control
Answer:
E
Question 15
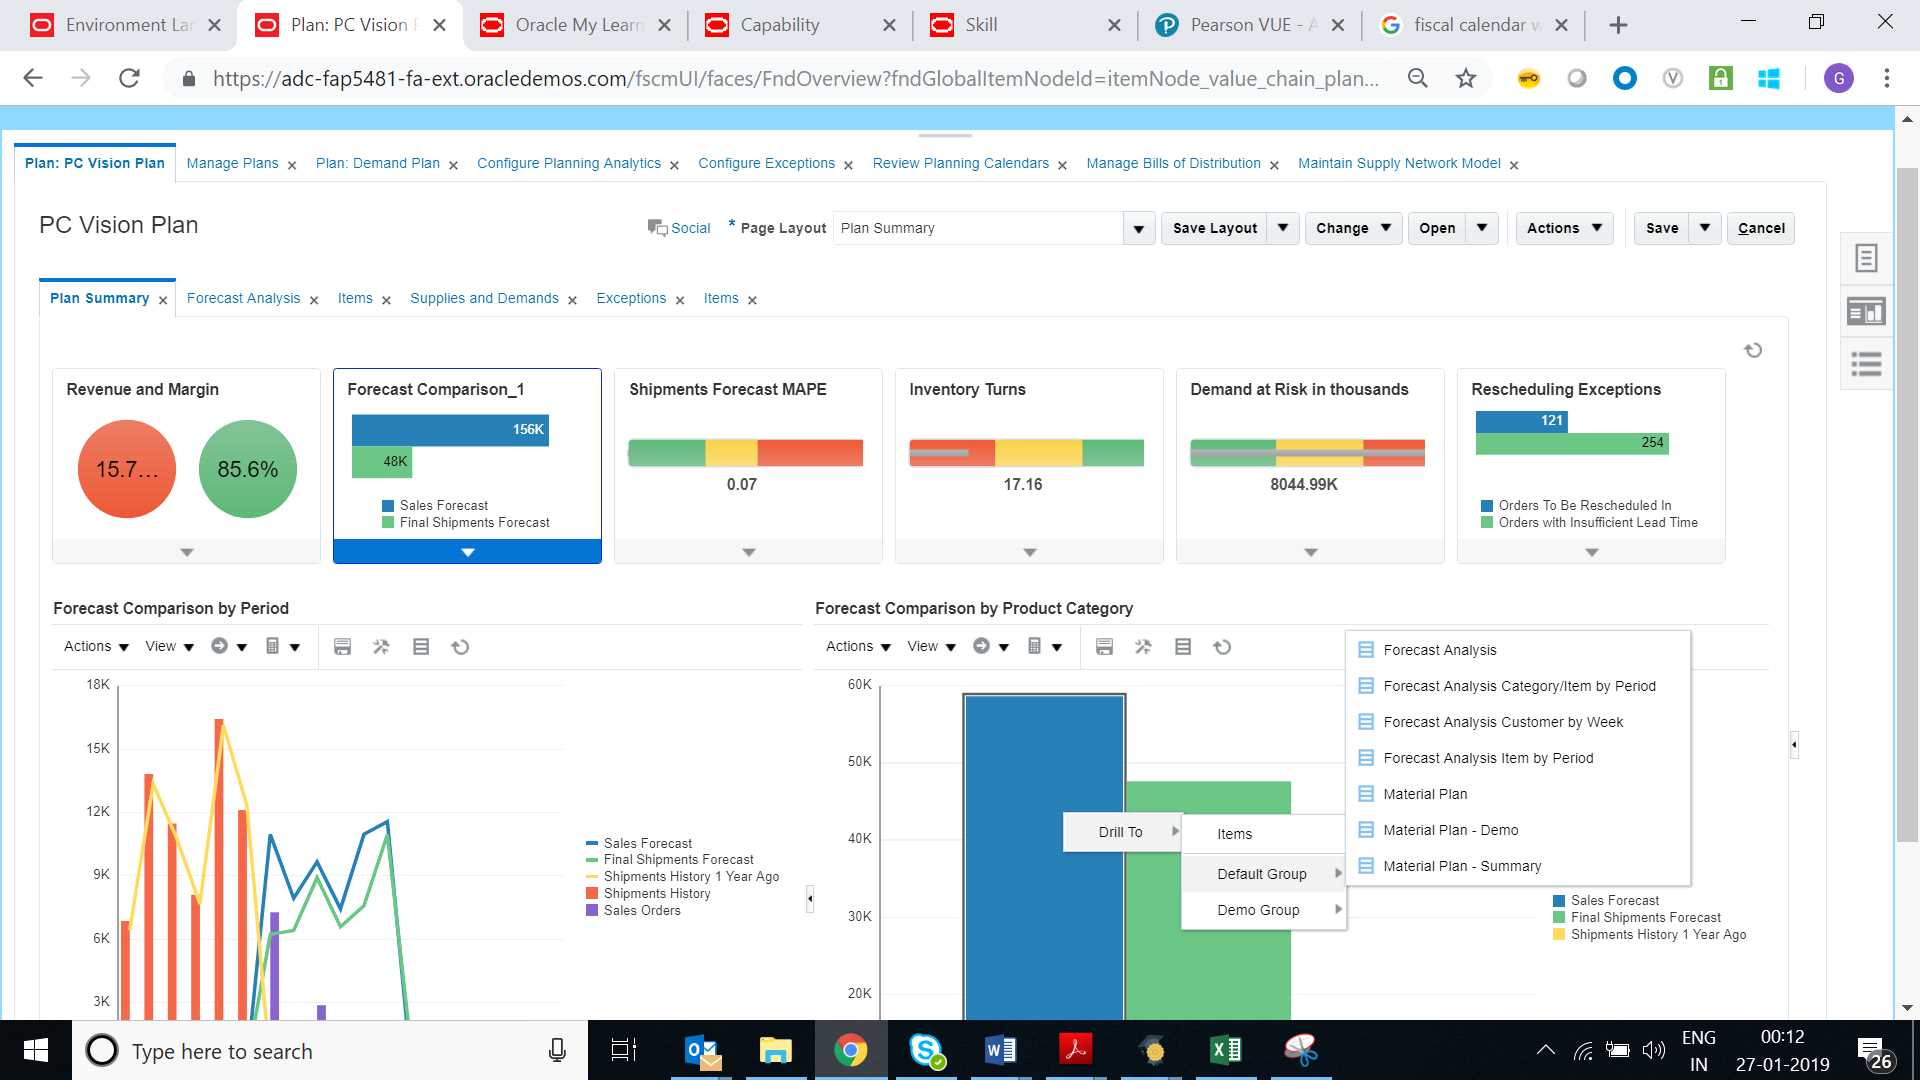
Demand planner opens the pre-seeded plan summary of the demand plan and wants to analyze the
forecast results. Describe the steps to review and analyze the forecast results.
- A. Click "Revenue and Margin" tile. Review the "Revenue by Period" graph and pick a specific period. Right-click on a period, click Drill To -> Default Group -> Revenue Analysis to open the table and review the details.
- B. Click "Forecast Comparison in the thousands" tile. Review "Forecast Comparison by Product Category" graph and pick a product category. Right-click on product category, click Drill To -> Default Group -> Forecast Analysis to open the table and review the details.
- C. Click "Revenue and Forecast" tile. Review "Revenue by Period" graph and pick a specific period. Right-click on a period, click Drill To -> Default Group -> Forecast Analysis to open the table and review the details.
- D. Click "Demand at Risk in thousands" tile. Review "Demand at Risk by Product Category" graph and pick a product category. Right-click on product category, click Drill To -> Default Group -> Demand Analysis to open the table and review the details.
Answer:
B
Explanation: