microsoft pl-300 practice test
Microsoft Power BI Data Analyst
Last exam update: Jul 20 ,2024
Question 1
You have a dataset that is used infrequently and refreshes every hour.
You receive a notification that the refresh was disabled due to inactivity.
Which two actions will cause the scheduled refresh schedule to resume? Each correct answer presents a complete solution.
NOTE: Each correct selection is worth one point.
- A. Enable query caching for the dataset.
- B. Import the dataset to Microsoft Excel.
- C. From the Power BI service, open a dashboard that uses the dataset.
- D. From the Power BI service, open a report that uses the dataset.
- E. From PowerShell, run the get-powerbireport cmdlet.
Answer:
cd
After two months of inactivity, scheduled refresh on your dataset is paused. A dataset is considered inactive when no user has visited any dashboard or report built on the dataset. At that time, the dataset owner is sent an email indicating the scheduled refresh is paused. The refresh schedule for the dataset is then displayed as disabled. To resume scheduled refresh, simply revisit any dashboard or report built on the dataset.
Incorrect:
Not E: get-powerbireport retrieves a list of Power BI reports that match the specified search criteria and scope.
Reference:
https://docs.microsoft.com/en-us/power-bi/connect-data/refresh-scheduled-refresh
Question 2
You are creating a sales report in Power BI for the NorthWest region sales territory of your company. Data will come from a view in a Microsoft SQL Server database. A sample of the data is shown in the following table: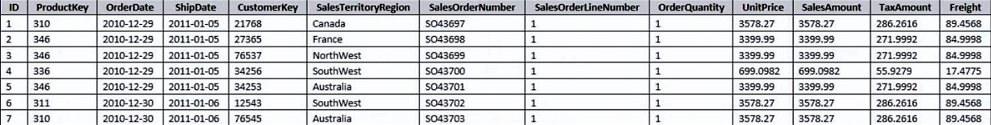
The report will facilitate the following analysis:
The count of orders and the sum of total sales by Order Date
The count of customers who placed an order
The average quantity per order
You need to reduce data refresh times and report query times.
Which two actions should you perform? Each correct answer presents part of the solution.
NOTE: Each correct selection is worth one point.
- A. Set the data type for SalesOrderNumber to Decimal Number.
- B. Remove the CustomerKey and ProductKey columns.
- C. Remove the TaxAmt and Freight columns.
- D. Filter the data to only the NorthWest region sales territory.
Answer:
cd
C: Remove columns that are not used in the report.
D: Reduce the number of rows.
Incorrect:
Not A: Not possible.
Not B: Need CustomerKey to count of customers who placed an order
Question 3
Note: This question is part of a series of questions that present the same scenario. Each question in the series contains a unique solution that might meet the stated goals. Some question sets might have more than one correct solution, while others might not have a correct solution.
After you answer a question in this section, you will NOT be able to return to it. As a result, these questions will not appear in the review screen.
You have a Power BI report that imports a date table and a sales table from an Azure SQL database data source. The sales table has the following date foreign keys:
Due Date
Order Date
Delivery Date
You need to support the analysis of sales over time based on all the date foreign keys.
Solution: From Power Query Editor, you rename the date query as Due Date. You reference the Due Date query twice to make the queries for Order Date and
Delivery Date.
Does this meet the goal?
- A. Yes
- B. No
Answer:
b
Instead: Solution: From the Fields pane, you rename the date table as Due Date. You use a DAX expression to create Order Date and Delivery Date as calculated tables.
Reference:
https://docs.microsoft.com/en-us/power-bi/guidance/relationships-active-inactive
Question 4
DRAG DROP
You use Power Query Editor to preview the data shown in the following exhibit.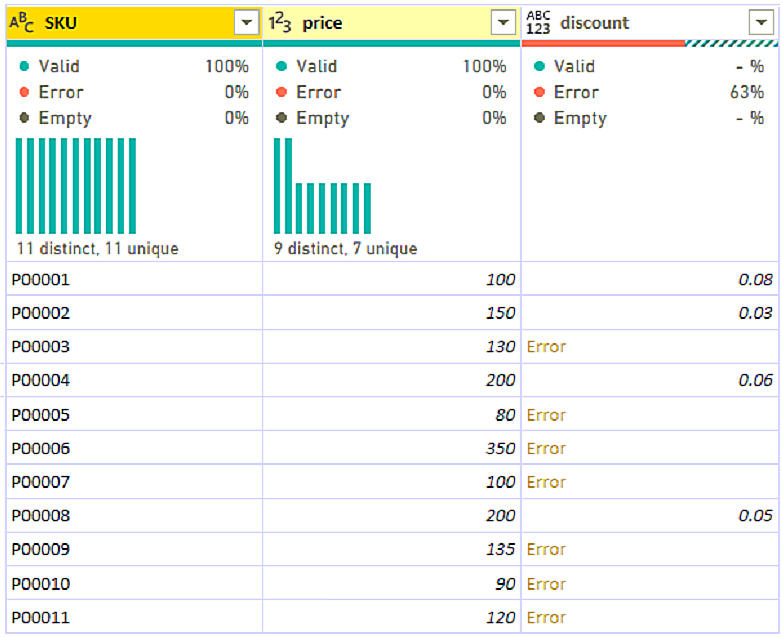
You need to clean and transform the query so that all the rows of data are maintained, and error values in the discount column are replaced with a discount of 0.05. The solution must minimize administrative effort.
Which three actions should you perform in sequence? To answer, move the appropriate actions from the list of actions to the answer area and arrange them in the correct order.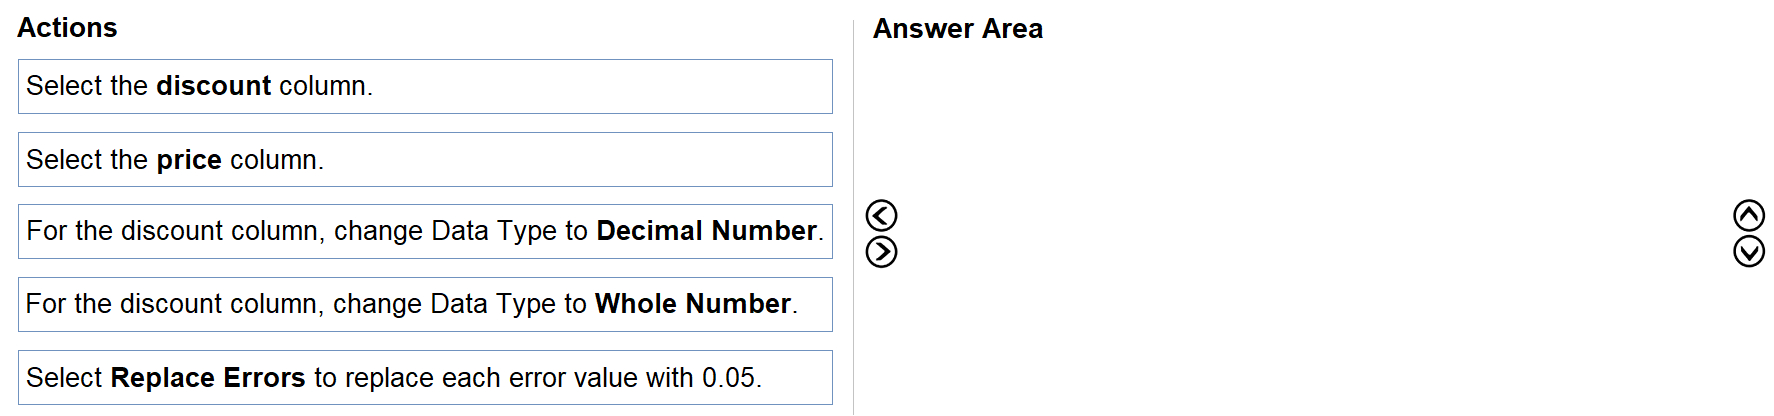
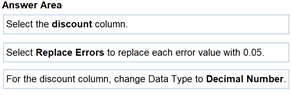
Answer:
None
Question 5
You have a Power BI model that contains a table named Sales. The Sales table contains the following columns:
Order Line ID
Product ID
Unit Price
Order ID
Quantity
Orders are uniquely identified by using the order ID and can have multiple order lines. Each order line within an order contains a different product ID.
You need to write a DAX measure that counts the number of orders.
Which formula should you use?
- A. Count('Sales'[Order ID])
- B. CountA('Sales' [Order ID])
- C. CountRows('Sales')
- D. DistinctCount('Sales' [Order ID])
Answer:
d
Question 6
You have a dashboard that contains tiles pinned from a single report as shown in the Original Dashboard exhibit. (Click the Original Dashboard tab.)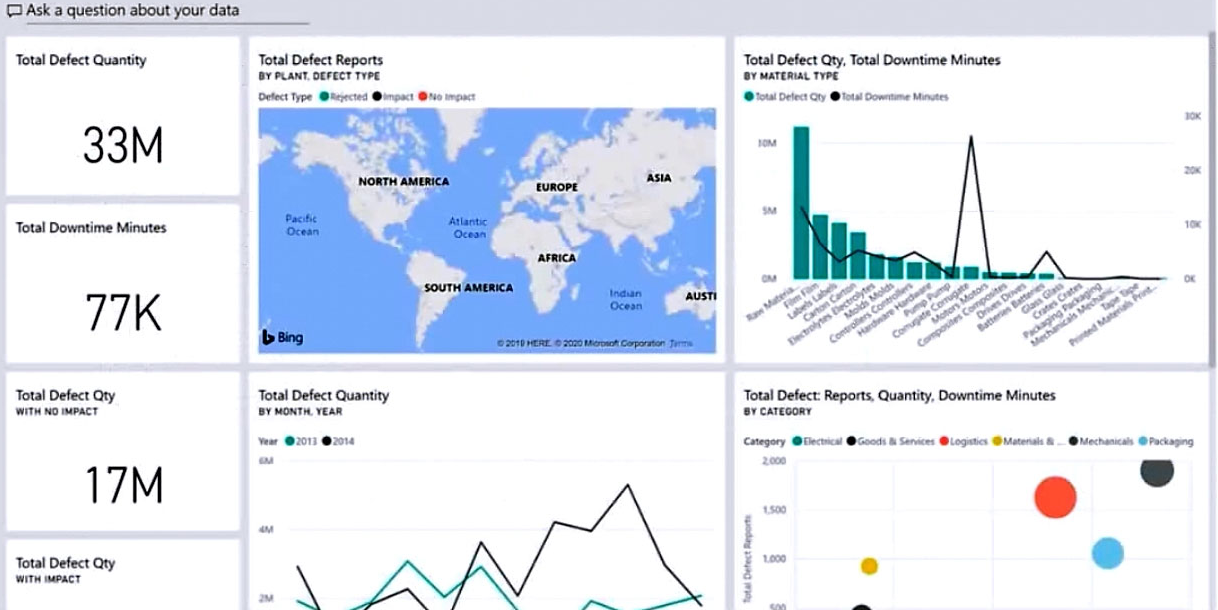
You need to modify the dashboard to appear as shown in the Modified Dashboard exhibit. (Click the Modified Dashboard tab.)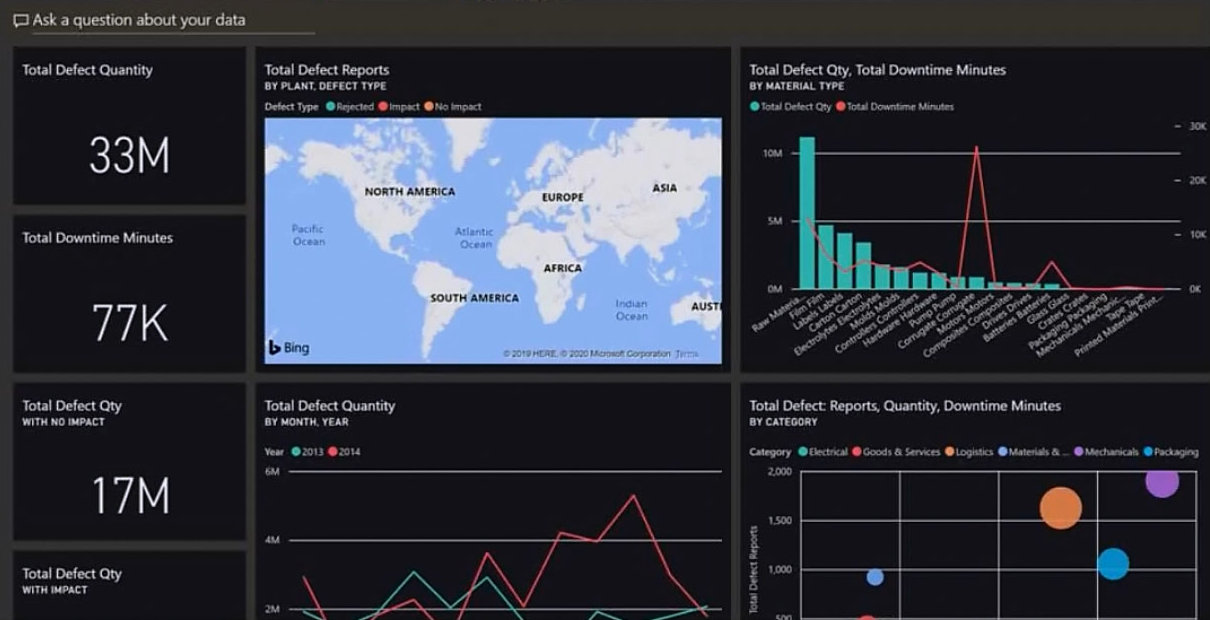
What should you do?
- A. Change the report theme.
- B. Change the dashboard theme.
- C. Edit the details of each tile.
- D. Create a custom CSS file.
Answer:
b
With dashboard themes you can apply a color theme to your entire dashboard, such as corporate colors, seasonal coloring, or any other color theme you might want to apply. When you apply a dashboard theme, all visuals on your dashboard use the colors from your selected theme.
Incorrect:
Not A: With Power BI Desktop report themes, you can apply design changes to your entire report, such as using corporate colors, changing icon sets, or applying new default visual formatting.
Reference:
https://docs.microsoft.com/en-us/power-bi/create-reports/service-dashboard-themes
Question 7
HOTSPOT You need to create a measure that returns the percent of revenue by product category.
How should you complete the measure? To answer, select the appropriate options in the answer area.
NOTE: Each correct selection is worth one point.
Hot Area: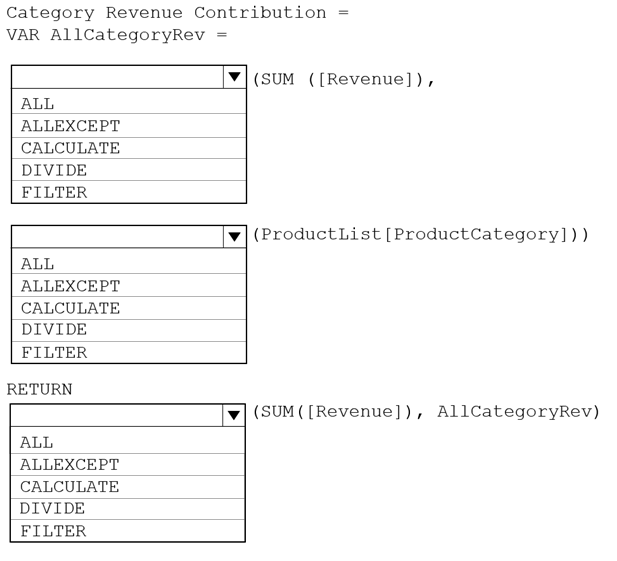
Answer:
None
Box 1: CALCULATE -
CALCULATE evaluates an expression in a modified filter context.
Syntax: CALCULATE(<expression>[, <filter1> [, <filter2> [, ]]])
Box 2: REMOVEFILTERS -
REMOVEFILTERS clear filters from the specified tables or columns.
Box 3: DIVIDE -
DIVIDE performs a division.
Example: MEASURE FactInternetSales[%Sales] = DIVIDE([TotalSales], CALCULATE([TotalSales],REMOVEFILTERS()))
Note: The RETURN keyword consumes variables defined in previous VAR statements.
Reference:
https://docs.microsoft.com/en-us/dax/calculate-function-dax
https://docs.microsoft.com/en-us/dax/removefilters-function-dax https://dax.guide/st/return/
Question 8
You have a Power BI data model that imports data from a Microsoft Excel spreadsheet.
You use Power Query to load a query that contains both renamed and custom columns.
Later, you attempt to reload the query and receive the following error message.
Expression.Error: The column 'Category' of the table wasn't found.
What are two possible causes of the error? Each correct answer presents a complete solution.
NOTE: Each correct selection is worth one point.
- A. The column was removed from the source file.
- B. The column was renamed in the source file.
- C. The file is no longer in the specified location.
- D. The data type of the column was changed.
Answer:
ab
Question 9
You have a Microsoft Power BI report. The size of PBIX file is 550 MB. The report is accessed by using an App workspace in shared capacity of powerbi.com.
The report uses an imported dataset that contains one fact table. The fact table contains 12 million rows. The dataset is scheduled to refresh twice a day at 08:00 and 17:00.
The report is a single page that contains 15 AppSource visuals and 10 default visuals.
Users say that the report is slow to load the visuals when they access and interact with the report.
You need to recommend a solution to improve the performance of the report.
What should you recommend?
- A. Change any DAX measures to use iterator functions.
- B. Remove unused columns from tables in the data model.
- C. Replace the default visuals with AppSource visuals.
- D. Increase the number of times that the dataset is refreshed.
Answer:
b
Question 10
You have a Power BI report that contains three pages named Page1, Page2, and Page3. All the pages have the same slicers.
You need to ensure that all the filters applied to Page1 apply to Page1 and Page3 only.
What should you do?
- A. On each page, modify the interactions of the slicer.
- B. Enable visibility of the slicers on Page1 and Page3. Disable visibility of the slicer on Page2.
- C. Sync the slicers on Page1 and Page3.
Answer:
a
Control which page visuals are affected by slicers
By default, slicers on report pages affect all the other visualizations on that page, including each other. As you choose values in the list and date slicers that you just created, notice the effects on the other visualizations. The filtered data is an intersection of the values selected in both slicers.
Use visual interactions to exclude some page visualizations from being affected by others. On the Overview page, the Total Sales Variance by FiscalMonth and
District Manager chart shows overall comparative data for district managers by month, which is information that you want to keep visible. Use visual interactions to keep slicer selections from filtering this chart.
1. Go to the Overview page of the report, and then select the DM slicer you previously created.
2. On the Power BI Desktop menu, select the Format menu under Visual Tools, and then select Edit interactions.
3. Filter controls, each with a Filter and a None option, appear above all the visuals on the page. Initially, the Filter option is preselected on all the controls.
4. Select the None option in the filter control above the Total Sales Variance by FiscalMonth and District Manager chart to stop the DM slicer from filtering it.
Reference:
https://docs.microsoft.com/en-us/power-bi/visuals/power-bi-visualization-slicers