Question 1
You are building a Power BI report.
Users will view the report by using their mobile device.
You need to configure the report to display data based on each user's location.
Which two actions should you perform? Each correct answer presents part of the solution.
NOTE: Each correct selection is worth one point.
- A. From Power Query Editor, detect the data types of the relevant columns.
- B. In Data Category, set the geographic data category for the relevant columns.
- C. Create a hierarchy for columns of the geography data type.
- D. Use the columns of the geography data type in all visuals.
- E. For the relevant columns, set synonyms to match common geographical terms.
Answer:
bd
B: Identify geographic data in your report
1. In Power BI Desktop, switch to Data View Data View icon.
2. Select a column with geographic data for example, a City column.
3. On the Modeling tab, select Data Category, then the correct category in this example, City.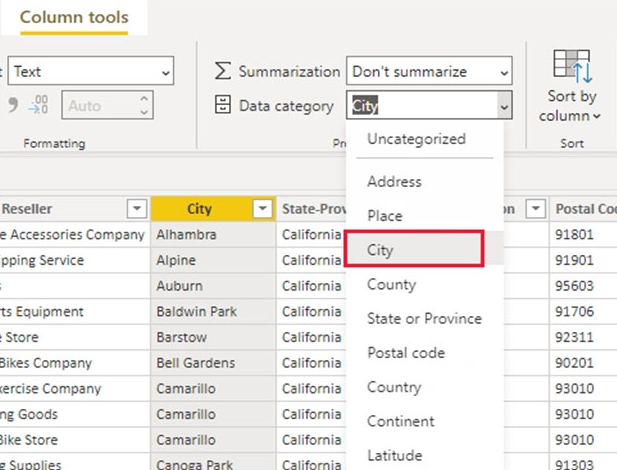
4. Continue setting geographic data categories for any other fields in the model.
D: Create visuals with your geographic data
Switch to Report view Report View icon, and create visuals that use the geographic fields in your data.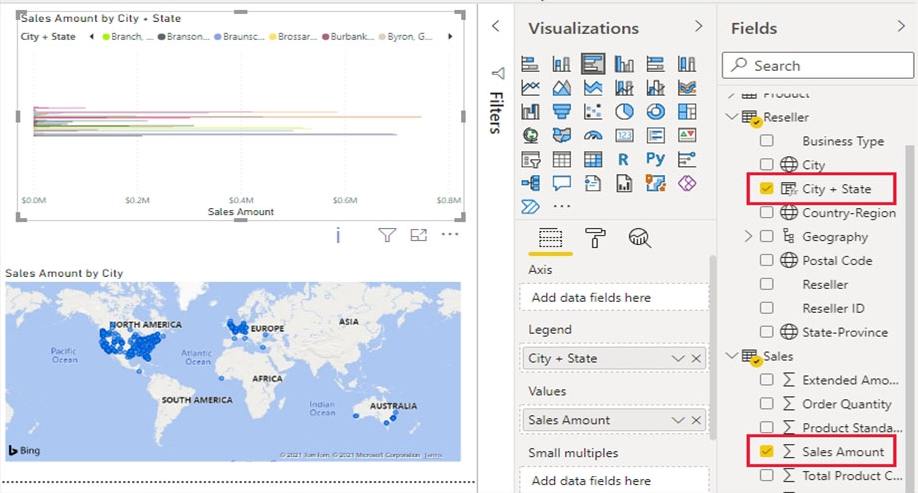
In this example, the model also contains a calculated column that brings city and state together in one column.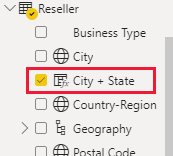
Publish the report to the Power BI service.
Reference:
https://docs.microsoft.com/en-us/power-bi/transform-model/desktop-mobile-geofiltering
Comments
Question 2
You have a collection of reports for the HR department of your company.
You need to create a visualization for the HR department that shows historical employee counts and predicts trends during the next six months.
Which type of visualization should you use?
- A. ribbon chart
- B. scatter chart
- C. line chart
- D. key influencers
Answer:
c
The best data for forecasting is time series data or uniformly increasing whole numbers. The line chart has to have only one line.
Reference:
https://powerbi.microsoft.com/fr-ca/blog/introducing-new-forecasting-capabilities-in-power-view-for-office-365/
Comments
Question 3
You have a report in Power BI named report1 that is based on a shared dataset.
You need to minimize the risk of data exfiltration for report. The solution must prevent other reports from being affected.
What should you do?
- A. Clear Allow recipients to share your dashboard and Allow users to build new content using the underlying datasets for the dataset.
- B. Apply row-level security (RLS) to the shared dataset.
- C. Select the Allow end users to export both summarized and underlying data from the service or Report Server Export data option for the report.
- D. Select the Don't allow end users to export any data from the service or Report Server Export data option for the report.
Answer:
d
Besides the various permissions you can set, there are also two different options to disable the export functionality. First of all is the Export data in general and second the Export to Excel as a specific setting. Both have the same setup for permissions
Export Data -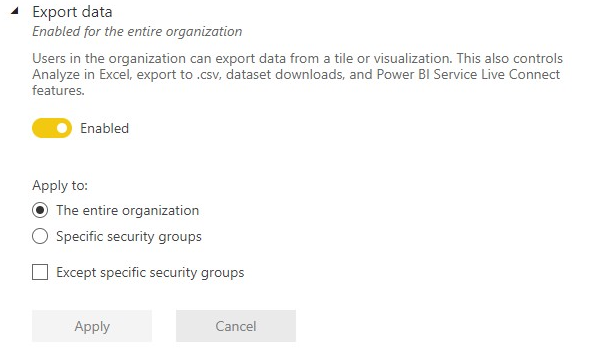
Reference:
https://data-marc.com/2020/04/13/power-bi-governance-why-you-should-consider-to-disable-export-to-excel/
Comments
Question 4
HOTSPOT You have a dataset that has the permissions shown in the following exhibit.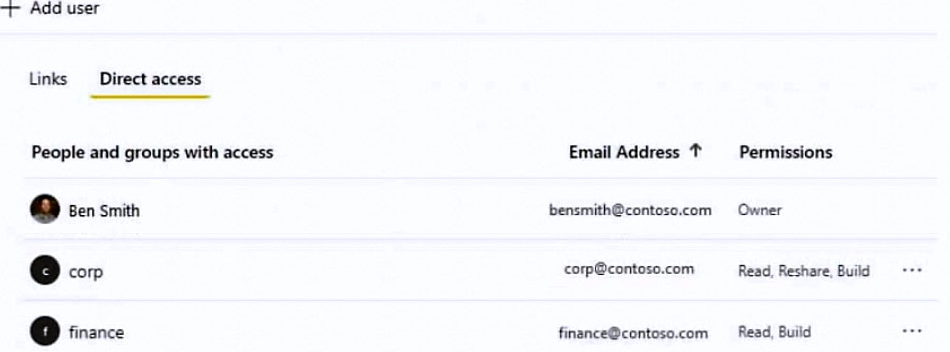
Use the drop-down menus to select the answer choice that completes each statement based on the information presented in the graphic.
NOTE: Each correct selection is worth one point.
Hot Area: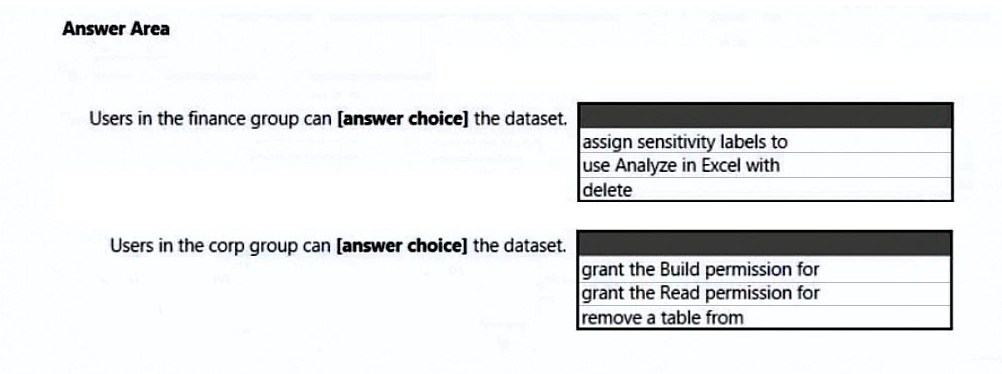
Answer:
None
Box 1: use Analyze in Excel -
Build permission applies to datasets. When you give users Build permission, they can build new content on your dataset, such as reports, dashboards, pinned tiles from Q&A, paginated reports, and Insights Discovery.
Users also need Build permissions to work with the data outside Power BI:
To export the underlying data.
To build new content on the dataset such as with Analyze in Excel.
To access the data via the XMLA endpoint.
Box 2: grant the Read permission for
The Corp group has read, share and rebuild permissions.
As a property of the Power BI App, you can allow users to share the app and underlying dataset with share permissions.
Reference:
https://docs.microsoft.com/en-us/power-bi/connect-data/service-datasets-build-permissions https://data-marc.com/2021/07/30/transform-a-local-into-a-global-power-bi-solution-request-access-to-content/
Comments
Question 5
You need to create the required relationship for the executive's visual.
What should you do before you can create the relationship?
- A. Change the data type of Sales[region_id] to Whole Number.
- B. Change the data type of Sales[region_id] to Decimal Number.
- C. In the Sales table, add a measure for Sum(sales_amount).
- D. Change the data type of Sales[sales_id] to Text.
Answer:
a
Executives require a visual that shows sales by region.
The data type of Sales[region_id] must be changed from varchar to Whole Number, as Sales[region_id] is Integer.
Comments
Question 6
Note: This question is part of a series of questions that present the same scenario. Each question in the series contains a unique solution that might meet the stated goals. Some question sets might have more than one correct solution, while others might not have a correct solution.
After you answer a question in this section, you will NOT be able to return to it. As a result, these questions will not appear in the review screen.
You have five reports and two dashboards in a workspace.
You need to grant all organizational users read access to one dashboard and three reports.
Solution: You enable included in app for all assets.
Does this meet the goal?
- A. Yes
- B. No
Answer:
b
You need to specify the dashboard and the three reports to be included in the app.
Instead: You create an Azure Active Directory group that contains all the users. You share each selected report and the one dashboard to the group.
Note: A published App can provide the required access.
When the dashboards and reports in your workspace are ready, you choose which dashboards and reports you want to publish, then publish them as an app.
In Power BI, you can create official packaged content, then distribute it to a broad audience as an app. You create apps in workspaces, where you can collaborate on Power BI content with your colleagues. Then you can publish the finished app to large groups of people in your organization.
Reference:
https://docs.microsoft.com/en-us/power-bi/collaborate-share/service-create-distribute-apps
Comments
Question 7
Note: This question is part of a series of questions that present the same scenario. Each question in the series contains a unique solution that might meet the stated goals. Some question sets might have more than one correct solution, while others might not have a correct solution.
After you answer a question in this section, you will NOT be able to return to it. As a result, these questions will not appear in the review screen.
From Power Query Editor, you profile the data shown in the following exhibit.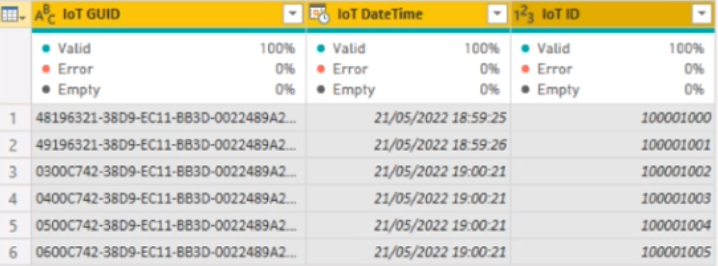
The IoT GUID and IoT ID columns are unique to each row in the query.
You need to analyze IoT events by the hour and day of the year. The solution must improve dataset performance.
Solution: You create a custom column that concatenates the IoT GUID column and the IoT ID column and then delete the IoT GUID and IoT ID columns.
Does this meet the goal?
- A. Yes
- B. No
Answer:
b
Comments
Question 8
You have multiple dashboards.
You need to ensure that when users browse the available dashboards from powerbi.com, they can see which dashboards contain Personally Identifiable
Information (PII). The solution must minimize configuration effort and impact on the dashboard design.
What should you use?
- A. Microsoft Information Protection sensitivity labels
- B. tiles
- C. comments
- D. Active Directory groups
Answer:
a
In the Power BI service, sensitivity labels can be applied to datasets, reports, dashboards, and dataflows.
Sensitivity labels on reports, dashboards, datasets, and dataflows are visible from many places in the Power BI service. Sensitivity labels on reports and dashboards are also visible in the Power BI iOS and Android mobile apps and in embedded visuals. In Desktop, you can see the sensitivity label in the status bar.
Reference:
https://docs.microsoft.com/en-us/power-bi/enterprise/service-security-sensitivity-label-overview
Comments
Question 9
HOTSPOT You have a Power BI visual that uses indicators to show values that are out of range as shown in the following exhibit.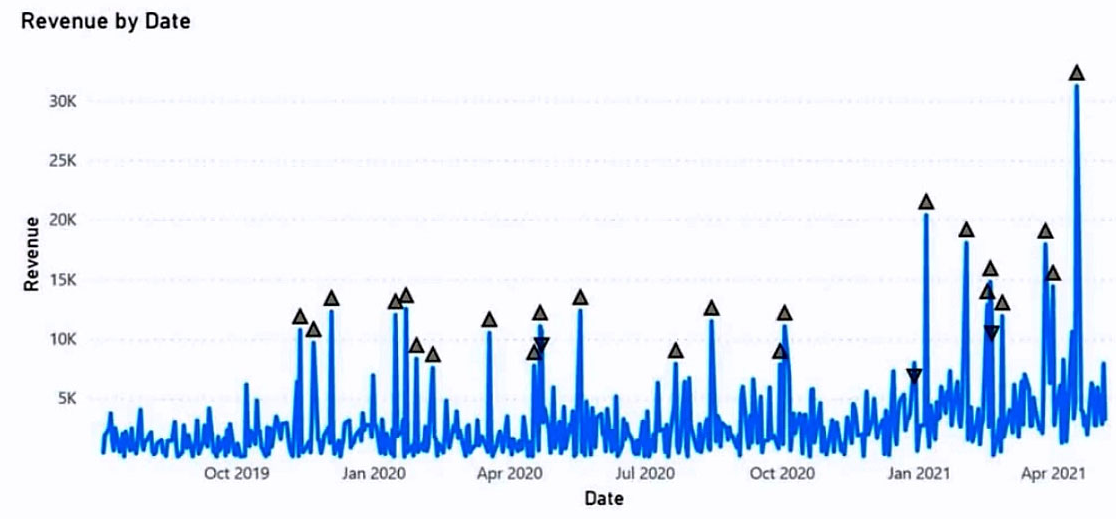
Use the drop-down menus to select the answer choice that completes each statement based on the information presented in the graphic.
NOTE: Each correct selection is worth one point.
Hot Area:
Answer:
None
Box 1: a line -
Incorrect:
* not line and clustered column
The Line and Clustered Column Chart is a combo charts that combines the Line chart and Column chart together in one visual. By combining these two visuals together, you can make a very quick comparison between two sets of measures.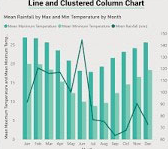
Box 2: anomaly detection -
Anomaly detection helps you enhance your line charts by automatically detecting anomalies in your time series data. It also provides explanations for the anomalies to help with root cause analysis. With just a couple of clicks, you can easily find insights without slicing and dicing the data.
Example: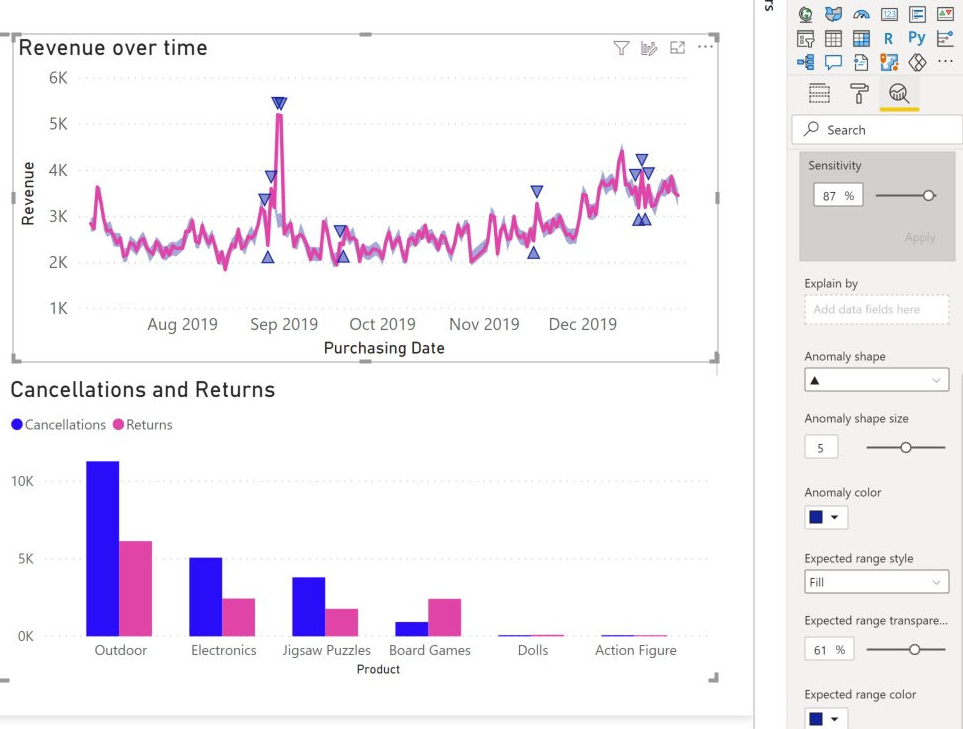
Reference:
https://docs.microsoft.com/en-us/power-bi/visuals/power-bi-visualization-anomaly-detection
Comments
Question 10
You need to create a visual that enables the adhoc exploration of data as shown in the following exhibit.
Which type of visual should you use?
- A. smart narrative
- B. decomposition tree
- C. Q&A
- D. key influencers
Answer:
b
The decomposition tree visual in Power BI lets you visualize data across multiple dimensions. It automatically aggregates data and enables drilling down into your dimensions in any order. It is also an artificial intelligence (AI) visualization, so you can ask it to find the next dimension to drill down into based on certain criteria.
This makes it a valuable tool for ad hoc exploration and conducting root cause analysis.
Example: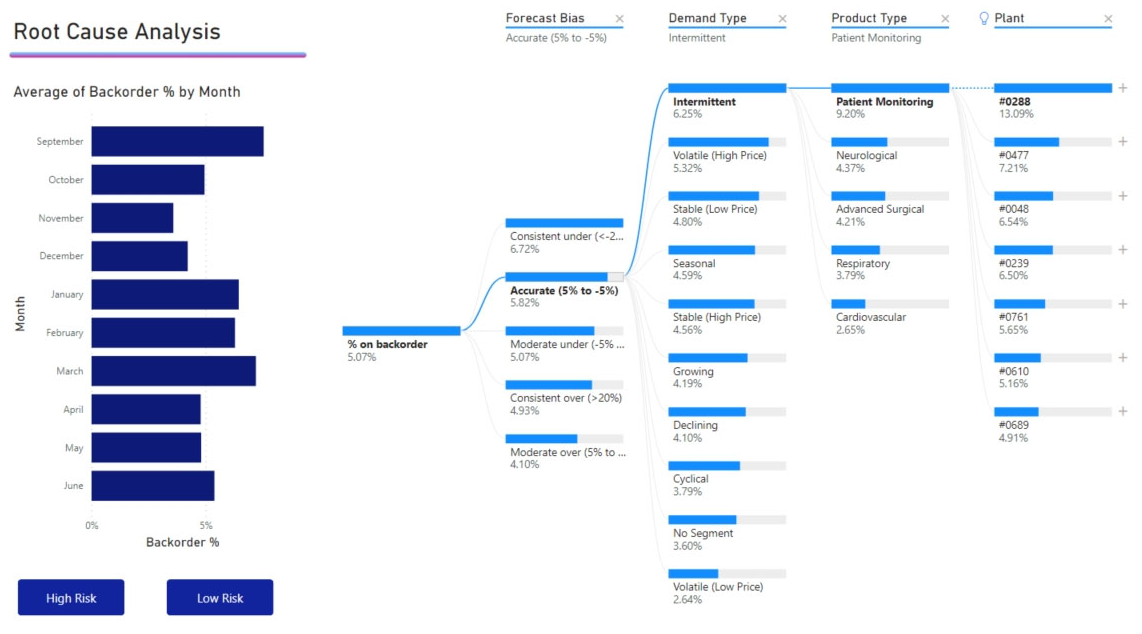
Reference:
https://docs.microsoft.com/en-us/power-bi/visuals/power-bi-visualization-decomposition-tree
Comments
Page 1 out of 22
Viewing questions 1-10 out of 224
page 2