microsoft dp-900 practice test
Microsoft Azure Data Fundamentals
Last exam update: Jul 20 ,2024
Question 1 Topic 4, Describe an analytics workload on Azure
HOTSPOT
For each of the following statements, select Yes if the statement is true. Otherwise, select No.
NOTE: Each correct selection is worth one point.
Hot Area: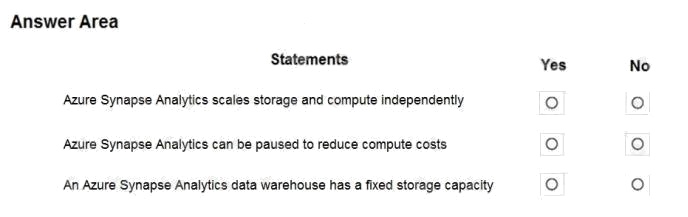
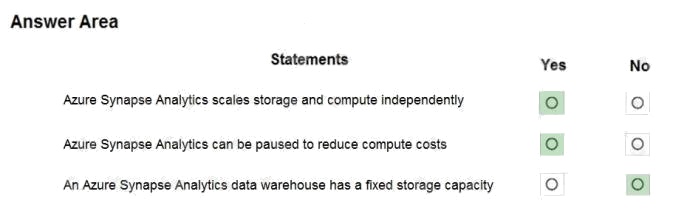
Answer:
Explanation:
Box 1: Yes
Compute is separate from storage, which enables you to scale compute independently of the data in your system.
Box 2: Yes
You can use the Azure portal to pause and resume the dedicated SQL pool compute resources.
Pausing the data warehouse pauses compute. If your data warehouse was paused for the entire hour, you will not be
charged compute during that hour.
Box 3: No
Storage is sold in 1 TB allocations. If you grow beyond 1 TB of storage, your storage account will automatically grow to 2
TBs.
Reference:
https://azure.microsoft.com/en-us/pricing/details/synapse-analytics/
Question 2 Topic 4, Describe an analytics workload on Azure
DRAG DROP
Match the Azure services to the appropriate requirements.
To answer, drag the appropriate service from the column on the left to its requirement on the right. Each service may be
used once, more than once, or not at all.
NOTE: Each correct match is worth one point.
Select and Place: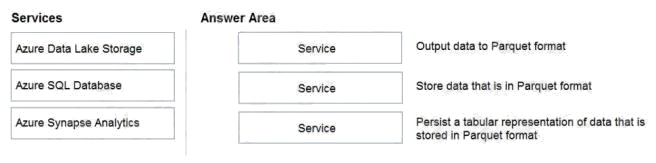
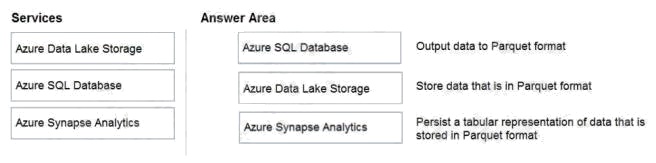
Answer:
Explanation:
Box 1: Azure Data Factory
Box 2: Azure Data Lake Storage
Azure Data Lake Storage (ADLA) now natively supports Parquet files. ADLA adds a public preview of the native extractor
and outputter for the popular Parquet file format
Box 3: Azure Synapse Analytics
Use Azure Synapse Analytics Workspaces.
Reference:
https://docs.microsoft.com/en-us/azure/data-factory/supported-file-formats-and-compression-codecs
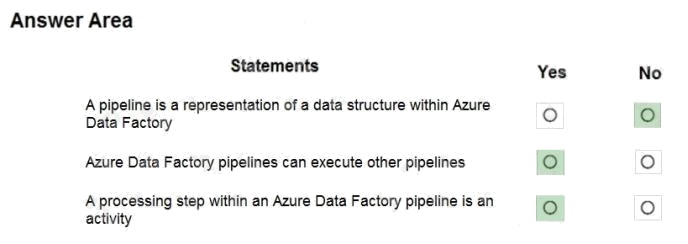
Question 3 Topic 4, Describe an analytics workload on Azure
HOTSPOT
For each of the following statements, select Yes if the statement is true. Otherwise, select No.
NOTE: Each correct selection is worth one point.
Hot Area:
Answer:
Explanation:
Box 1: No
A pipeline is a logical grouping of activities that together perform a task.
Box 2: Yes
You can construct pipeline hierarchies with data factory.
Box 3: Yes
A pipeline is a logical grouping of activities that together perform a task.
Reference: https://mrpaulandrew.com/2019/09/25/azure-data-factory-pipeline-hierarchies-generation-control/
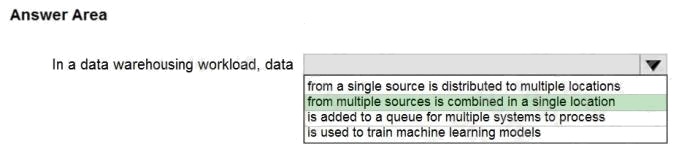
Question 4 Topic 4, Describe an analytics workload on Azure
HOTSPOT
To complete the sentence, select the appropriate option in the answer area.
Hot Area:
Answer:
Explanation:
Note: The data warehouse workload encompasses: The entire process of loading data into the warehouse
Performing data warehouse analysis and reporting
Managing data in the data warehouse
Exporting data from the data warehouse
Reference: https://docs.microsoft.com/en-us/azure/synapse-analytics/sql-data-warehouse/sql-data-warehouse-workload-
management
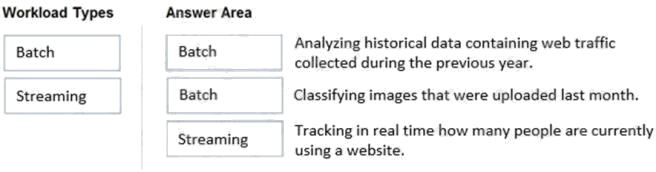
Question 5 Topic 4, Describe an analytics workload on Azure
DRAG DROP
Match the types of workloads to the appropriate scenarios.
To answer, drag the appropriate workload type from the column on the left to its scenario on the right. Each workload type
may be used once, more than once, or not at all.
NOTE: Each correct match is worth one point.
Select and Place: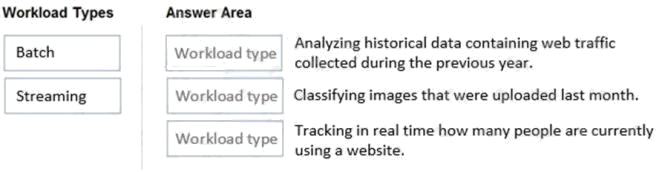
Answer:
Explanation:
Box 1: Batch
The batch processing model requires a set of data that is collected over time while the stream processing model requires
data to be fed into an analytics tool, often in micro-batches, and in real-time.
The batch Processing model handles a large batch of data while the Stream processing model handles individual records or
micro-batches of few records. In Batch Processing, it processes over all or most of the data but in Stream Processing, it
processes over data on a rolling window or most recent record.
Box 2: Batch
Box 3: Streaming Reference:
https://k21academy.com/microsoft-azure/dp-200/batch-processing-vs-stream-processing
Question 6 Topic 4, Describe an analytics workload on Azure
DRAG DROP
Match the Azure services to the appropriate locations in the architecture.
To answer, drag the appropriate service from the column on the left to its location on the right. Each service may be used
once, more than once, or not at all.
NOTE: Each correct match is worth one point.
Select and Place: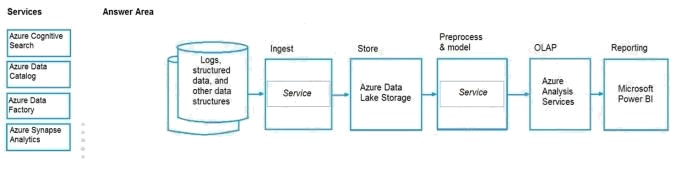
Answer:
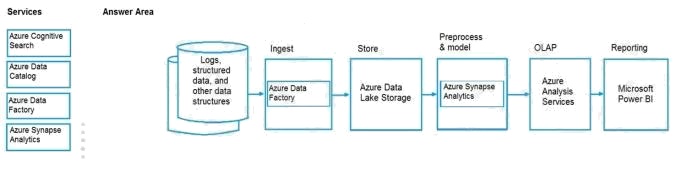
Explanation:
Box Ingest: Azure Data Factory
You can build a data ingestion pipeline with Azure Data Factory (ADF).
Box Preprocess & model: Azure Synapse Analytics
Use Azure Synapse Analytics to preprocess data and deploy machine learning models.
Reference: https://docs.microsoft.com/en-us/azure/machine-learning/how-to-data-ingest-adf https://docs.microsoft.com/en-
us/azure/machine-learning/team-data-science-process/sqldw-walkthrough
Question 7 Topic 4, Describe an analytics workload on Azure
What is the primary purpose of a data warehouse?
- A. to provide answers to complex queries that rely on data from multiple sources
- B. to provide transformation services between source and target data stores
- C. to provide read-only storage of relational and non-relational historical data
- D. to provide storage for transactional line-of-business (LOB) applications
Answer:
C
Explanation:
Consider using a data warehouse when you need to keep historical data separate from the source transaction systems for
performance reasons. Data warehouses make it easy to access historical data from multiple locations, by providing a
centralized location using common formats, keys, and data models.
Query both relational and nonrelational data.
Incorrect Answers:
D: Data warehouses don't need to follow the same terse data structure you may be using in your OLTP databases.
Reference:
https://docs.microsoft.com/en-us/azure/architecture/data-guide/relational-data/data-warehousing
Question 8 Topic 4, Describe an analytics workload on Azure
What are three characteristics of an Online Transaction Processing (OLTP) workload? Each correct answer presents a
complete solution.
NOTE: Each correct selection is worth one point.
- A. denormalized data
- B. heavy writes and moderate reads
- C. light writes and heavy reads
- D. schema defined in a database
- E. schema defined when reading unstructured data from a database
- F. normalized data
Answer:
B D F
Explanation:
B: Transactional data tends to be heavy writes, moderate reads.
D: Typical traits of transactional data include: schema on write, strongly enforced. The schema is defined in a database. F:
Transactional data tends to be highly normalized.
Reference:
https://docs.microsoft.com/en-us/azure/architecture/data-guide/relational-data/online-transaction-processing
Question 9 Topic 4, Describe an analytics workload on Azure
HOTSPOT
For each of the following statements, select Yes if the statement is true. Otherwise, select No.
NOTE: Each correct selection is worth one point.
Hot Area: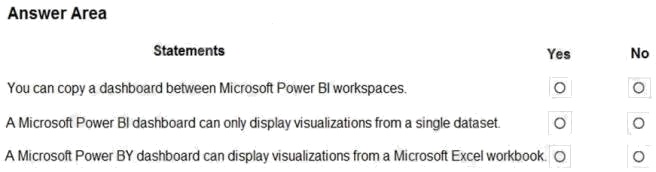
Answer:
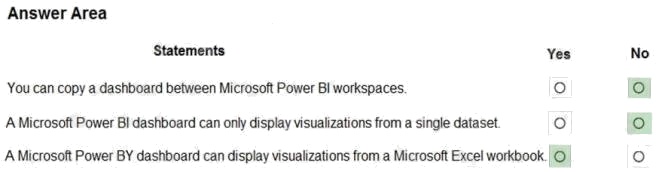
Explanation:
Box 1: No
You can duplicate a dashboard. The duplicate ends up in the same Power BI workspace.
There is no current functionality that allows you to move reports from one workspace to another.
Box 2: No Box 3: Yes
Reference: https://docs.microsoft.com/en-us/power-bi/connect-data/service-datasets-across-workspaces
https://docs.microsoft.com/en-us/power-bi/consumer/end-user-dashboardshttps://powerbi.microsoft.com/en-us/excel-and-
power-bi/
Question 10 Topic 4, Describe an analytics workload on Azure
You need to use Transact-SQL to query files in Azure Data Lake Storage Gen 2 from an Azure Synapse Analytics data
warehouse.
What should you use to query the files?
- A. Azure Functions
- B. Microsoft SQL Server Integration Services (SSIS)
- C. PolyBase
- D. Azure Data Factory
Answer:
C
Explanation:
Reference:
https://docs.databricks.com/data/data-sources/azure/synapse-analytics.html
Question 11 Topic 4, Describe an analytics workload on Azure
What are two uses of data visualization? Each correct answer presents a complete solution.
NOTE: Each correct selection is worth one point.
- A. Represent trends and patterns over time
- B. Implement machine learning to predict future values
- C. Communicate the significance of data
- D. Enforce business logic across reports
Answer:
A C
Explanation:
Data visualization is a key component in being able to gain insight into your data. It helps make big and small data easier for
humans to understand. It also makes it easier to detect patterns, trends, and outliers in groups of data.
Data visualization brings data to help you find key business insights quickly and effectively.
Reference:
https://docs.microsoft.com/en-us/azure/synapse-analytics/spark/apache-spark-data-visualization
Question 12 Topic 4, Describe an analytics workload on Azure
HOTSPOT
To complete the sentence, select the appropriate option in the answer area.
Hot Area: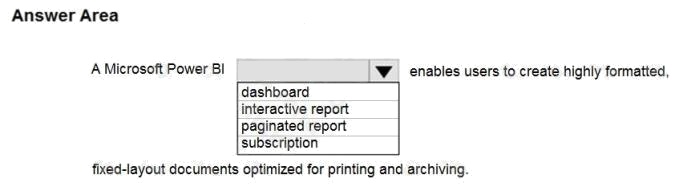
Answer:
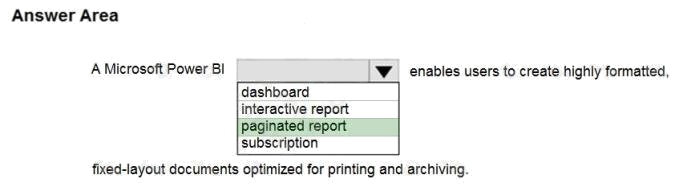
Explanation:
Paginated Reports in Power BI now allows users to generate these fixed-layout documents optimized for printing and
archiving, such as PDF and Word files.
These document-style reports with visualizations that provide additional control, like which tables expand horizontally and
vertically to display all their data and continue from page to page as needed.
Reference:
https://powerbi.microsoft.com/en-us/blog/announcing-paginated-reports-in-power-bi-general-availability/
Question 13 Topic 4, Describe an analytics workload on Azure
Which Azure Data Factory component provides the compute environment for activities?
- A. SSIS packages
- B. an integration runtime
- C. a control flow
- D. a pipeline
Answer:
B
Explanation:
The Integration Runtime (IR) is the compute infrastructure used by Azure Data Factory to provide the following data
integration capabilities across different network environments: Data Flow
Data movement
Activity dispatch
SSIS package execution
Reference:
https://docs.microsoft.com/en-us/azure/data-factory/concepts-integration-runtime
Question 14 Topic 4, Describe an analytics workload on Azure
HOTSPOT
For each of the following statements, select Yes if the statement is true. Otherwise, select No.
NOTE: Each correct selection is worth one point.
Hot Area: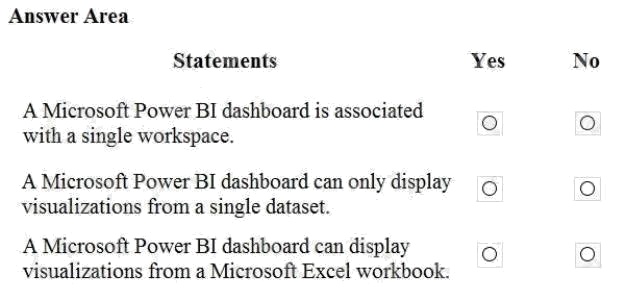
Answer:

Explanation:
Reference: https://docs.microsoft.com/en-us/power-bi/connect-data/service-datasets-across-workspaces
https://docs.microsoft.com/en-us/power-bi/consumer/end-user-dashboardshttps://powerbi.microsoft.com/en-us/excel-and-
power-bi/
Question 15 Topic 4, Describe an analytics workload on Azure
Which three objects can be added to a Microsoft Power BI dashboard? Each correct answer presents a complete solution.
NOTE: Each correct selection is worth one point.
- A. a report page
- B. a Microsoft PowerPoint slide
- C. a visualization from a report
- D. a dataflow
- E. a text box
Answer:
A C E
Explanation:
Reference: https://docs.microsoft.com/en-us/power-bi/consumer/end-user-dashboards https://docs.microsoft.com/en-
us/power-bi/create-reports/service-dashboard-add-widget