microsoft dp-100 practice test
Designing and Implementing a Data Science Solution on Azure
Note: Test Case questions are at the end of the exam
Last exam update: Jun 25 ,2025
Question 1 Topic 3, Mixed Questions
DRAG DROP
You have a model with a large difference between the training and validation error values.
You must create a new model and perform cross-validation.
You need to identify a parameter set for the new model using Azure Machine Learning Studio.
Which module you should use for each step? To answer, drag the appropriate modules to the correct steps. Each module
may be used once or more than once, or not at all. You may need to drag the split bar between panes or scroll to view
content.
NOTE: Each correct selection is worth one point.
Select and Place: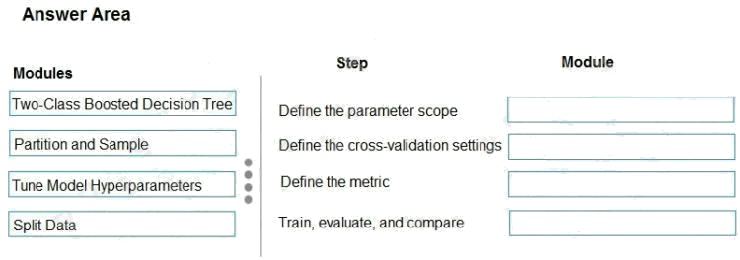
Answer:
Explanation:
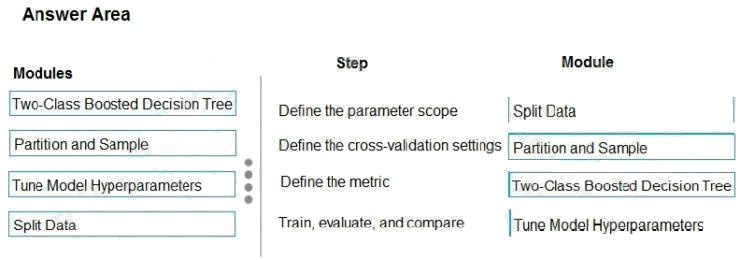
Box 1: Split data
Box 2: Partition and Sample
Box 3: Two-Class Boosted Decision Tree
Box 4: Tune Model Hyperparameters
Integrated train and tune: You configure a set of parameters to use, and then let the module iterate over multiple
combinations, measuring accuracy until it finds a "best" model. With most learner modules, you can choose which
parameters should be changed during the training process, and which should remain fixed.
We recommend that you use Cross-Validate Model to establish the goodness of the model given the specified parameters.
Use Tune Model Hyperparameters to identify the optimal parameters.
References: https://docs.microsoft.com/en-us/azure/machine-learning/studio-module-reference/partition-and-sample
Question 2 Topic 3, Mixed Questions
HOTSPOT
You are using a decision tree algorithm. You have trained a model that generalizes well at a tree depth equal to 10.
You need to select the bias and variance properties of the model with varying tree depth values.
Which properties should you select for each tree depth? To answer, select the appropriate options in the answer area.
Hot Area: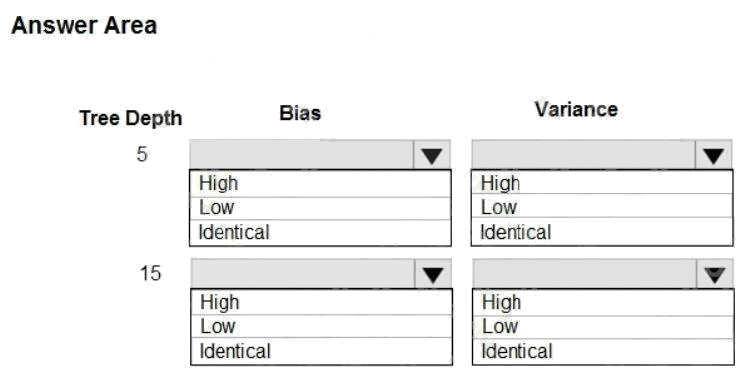
Answer:
Explanation:
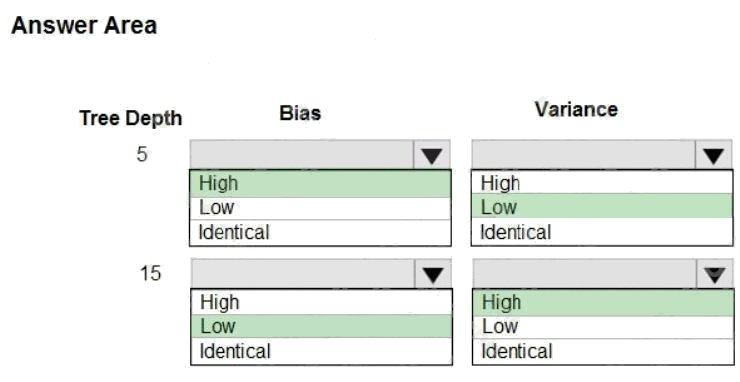
In decision trees, the depth of the tree determines the variance. A complicated decision tree (e.g. deep) has low bias and
high variance.
Note: In statistics and machine learning, the biasvariance tradeoff is the property of a set of predictive models whereby
models with a lower bias in parameter estimation have a higher variance of the parameter estimates across samples, and
vice versa. Increasing the bias will decrease the variance. Increasing the variance will decrease the bias.
References: https://machinelearningmastery.com/gentle-introduction-to-the-bias-variance-trade-off-in-machine-learning/
Question 3 Topic 3, Mixed Questions
HOTSPOT
You are developing a linear regression model in Azure Machine Learning Studio. You run an experiment to compare
different algorithms.
The following image displays the results dataset output: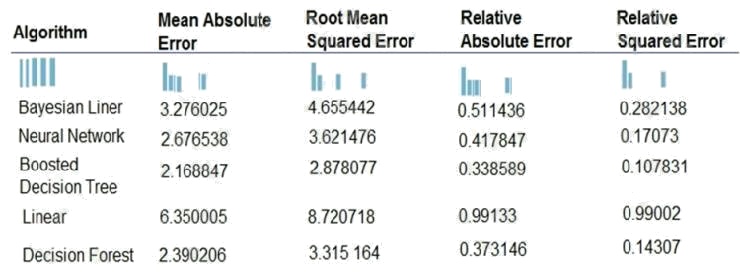
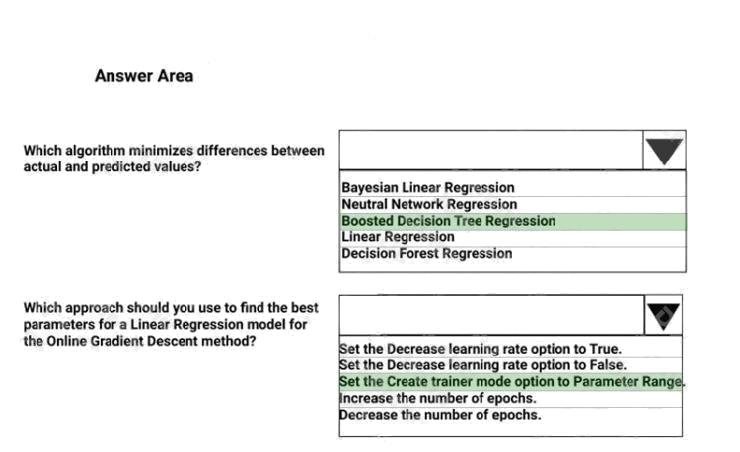
Use the drop-down menus to select the answer choice that answers each question based on the information presented in
the image.
NOTE: Each correct selection is worth one point.
Hot Area: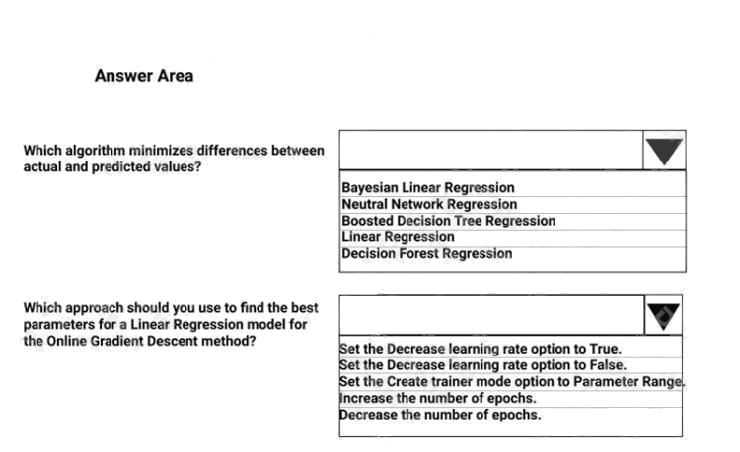
Answer:
Explanation:
Box 1: Boosted Decision Tree Regression
Mean absolute error (MAE) measures how close the predictions are to the actual outcomes; thus, a lower score is better.
Box 2:
Online Gradient Descent: If you want the algorithm to find the best parameters for you, set Create trainer mode option to
Parameter Range. You can then specify multiple values for the algorithm to try.
References: https://docs.microsoft.com/en-us/azure/machine-learning/studio-module-reference/evaluate-model
https://docs.microsoft.com/en-us/azure/machine-learning/studio-module-reference/linear-regression
Question 4 Topic 3, Mixed Questions
You are creating a binary classification by using a two-class logistic regression model.
You need to evaluate the model results for imbalance.
Which evaluation metric should you use?
- A. Relative Absolute Error
- B. AUC Curve
- C. Mean Absolute Error
- D. Relative Squared Error
- E. Accuracy
- F. Root Mean Square Error
Answer:
B
Explanation:
One can inspect the true positive rate vs. the false positive rate in the Receiver Operating Characteristic (ROC) curve and
the corresponding Area Under the Curve (AUC) value. The closer this curve is to the upper left corner; the better the
classifier's performance is (that is maximizing the true positive rate while minimizing the false positive rate). Curves that are
close to the diagonal of the plot, result from classifiers that tend to make predictions that are close to random guessing.
Reference:
https://docs.microsoft.com/en-us/azure/machine-learning/studio/evaluate-model-performance#evaluating-a-binary-
classification-model
Question 5 Topic 3, Mixed Questions
You are a data scientist creating a linear regression model.
You need to determine how closely the data fits the regression line.
Which metric should you review?
- A. Root Mean Square Error
- B. Coefficient of determination
- C. Recall
- D. Precision
- E. Mean absolute error
Answer:
B
Explanation:
Coefficient of determination, often referred to as R2, represents the predictive power of the model as a value between 0 and
1. Zero means the model is random (explains nothing); 1 means there is a perfect fit. However, caution should be used in
interpreting R2 values, as low values can be entirely normal and high values can be suspect.
Incorrect Answers:
A: Root mean squared error (RMSE) creates a single value that summarizes the error in the model. By squaring the
difference, the metric disregards the difference between over-prediction and underprediction.
C: Recall is the fraction of all correct results returned by the model.
D: Precision is the proportion of true results over all positive results.
E: Mean absolute error (MAE) measures how close the predictions are to the actual outcomes; thus, a lower score is better.
Reference:
https://docs.microsoft.com/en-us/azure/machine-learning/studio-module-reference/evaluate-model
Question 6 Topic 3, Mixed Questions
Note: This question is part of a series of questions that present the same scenario. Each question in the series contains a
unique solution that might meet the stated goals. Some question sets might have more than one correct solution, while
others might not have a correct solution.
After you answer a question in this section, you will NOT be able to return to it. As a result, these questions will not appear in
the review screen.
You are creating a model to predict the price of a student's artwork depending on the following variables: the student's length
of education, degree type, and art form.
You start by creating a linear regression model.
You need to evaluate the linear regression model.
Solution: Use the following metrics: Relative Squared Error, Coefficient of Determination, Accuracy, Precision, Recall, F1
score, and AUC.
Does the solution meet the goal?
- A. Yes
- B. No
Answer:
B
Explanation:
Relative Squared Error, Coefficient of Determination are good metrics to evaluate the linear regression model, but the others
are metrics for classification models.
Reference:
https://docs.microsoft.com/en-us/azure/machine-learning/studio-module-reference/evaluate-model
Question 7 Topic 3, Mixed Questions
Note: This question is part of a series of questions that present the same scenario. Each question in the series contains a
unique solution that might meet the stated goals. Some question sets might have more than one correct solution, while
others might not have a correct solution.
After you answer a question in this section, you will NOT be able to return to it. As a result, these questions will not appear in
the review screen.
You are creating a model to predict the price of a student's artwork depending on the following variables: the student's length
of education, degree type, and art form.
You start by creating a linear regression model.
You need to evaluate the linear regression model.
Solution: Use the following metrics: Accuracy, Precision, Recall, F1 score, and AUC.
Does the solution meet the goal?
- A. Yes
- B. No
Answer:
B
Explanation:
Those are metrics for evaluating classification models, instead use: Mean Absolute Error, Root Mean Absolute Error,
Relative Absolute Error, Relative Squared Error, and the Coefficient of Determination.
Reference:
https://docs.microsoft.com/en-us/azure/machine-learning/studio-module-reference/evaluate-model
Question 8 Topic 3, Mixed Questions
Note: This question is part of a series of questions that present the same scenario. Each question in the series contains a
unique solution that might meet the stated goals. Some question sets might have more than one correct solution, while
others might not have a correct solution.
After you answer a question in this section, you will NOT be able to return to it. As a result, these questions will not appear in
the review screen.
You are creating a model to predict the price of a student's artwork depending on the following variables: the student's length
of education, degree type, and art form.
You start by creating a linear regression model.
You need to evaluate the linear regression model.
Solution: Use the following metrics: Mean Absolute Error, Root Mean Absolute Error, Relative Absolute Error, Relative
Squared Error, and the Coefficient of Determination.
Does the solution meet the goal?
- A. Yes
- B. No
Answer:
A
Explanation:
The following metrics are reported for evaluating regression models. When you compare models, they are ranked by the
metric you select for evaluation.
Mean absolute error (MAE) measures how close the predictions are to the actual outcomes; thus, a lower score is better.
Root mean squared error (RMSE) creates a single value that summarizes the error in the model. By squaring the difference,
the metric disregards the difference between over-prediction and underprediction.
Relative absolute error (RAE) is the relative absolute difference between expected and actual values; relative because the
mean difference is divided by the arithmetic mean.
Relative squared error (RSE) similarly normalizes the total squared error of the predicted values by dividing by the total
squared error of the actual values.
Mean Zero One Error (MZOE) indicates whether the prediction was correct or not. In other words: ZeroOneLoss(x,y) = 1
when x!=y; otherwise 0.
Coefficient of determination, often referred to as R2, represents the predictive power of the model as a value between 0 and
1. Zero means the model is random (explains nothing); 1 means there is a perfect fit. However, caution should be used in
interpreting R2 values, as low values can be entirely normal and high values can be suspect.
AUC.
Reference:
https://docs.microsoft.com/en-us/azure/machine-learning/studio-module-reference/evaluate-model
Question 9 Topic 3, Mixed Questions
You are performing feature engineering on a dataset.
You must add a feature named CityName and populate the column value with the text London.
You need to add the new feature to the dataset.
Which Azure Machine Learning Studio module should you use?
- A. Extract N-Gram Features from Text
- B. Edit Metadata
- C. Preprocess Text
- D. Apply SQL Transformation
Answer:
B
Explanation:
Typical metadata changes might include marking columns as features.
Reference:
https://docs.microsoft.com/en-us/azure/machine-learning/studio-module-reference/edit-metadata
Question 10 Topic 3, Mixed Questions
DRAG DROP
You are producing a multiple linear regression model in Azure Machine Learning Studio.
Several independent variables are highly correlated.
You need to select appropriate methods for conducting effective feature engineering on all the data.
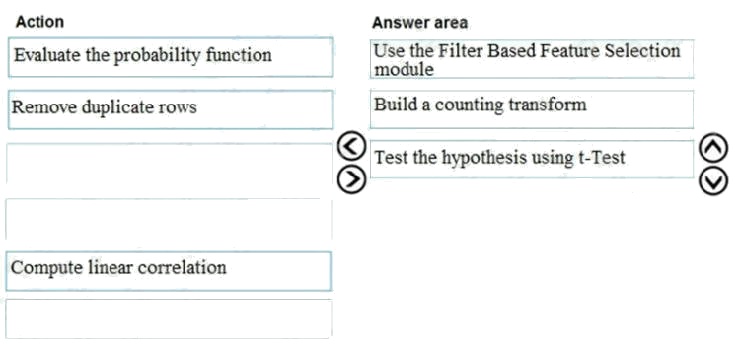
Which three actions should you perform in sequence? To answer, move the appropriate actions from the list of actions to the
answer area and arrange them in the correct order.
Select and Place: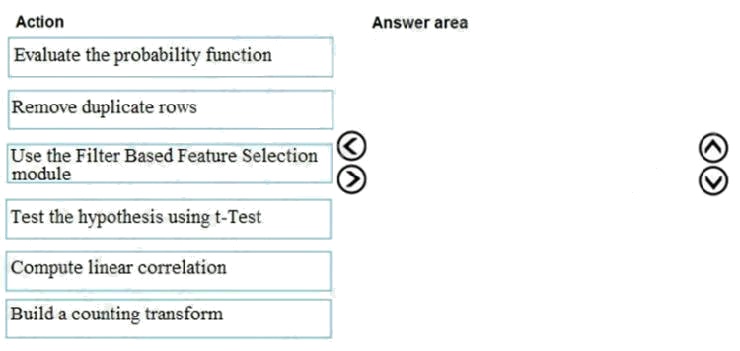
Answer:
Explanation:
Step 1: Use the Filter Based Feature Selection module
Filter Based Feature Selection identifies the features in a dataset with the greatest predictive power.
The module outputs a dataset that contains the best feature columns, as ranked by predictive power. It also outputs the
names of the features and their scores from the selected metric.
Step 2: Build a counting transform
A counting transform creates a transformation that turns count tables into features, so that you can apply the transformation
to multiple datasets. Step 3: Test the hypothesis using t-Test
Reference: https://docs.microsoft.com/bs-latn-ba/azure/machine-learning/studio-module-reference/filter-based-feature-
selection https://docs.microsoft.com/en-us/azure/machine-learning/studio-module-reference/build-counting-transform
Question 11 Topic 3, Mixed Questions
You are determining if two sets of data are significantly different from one another by using Azure Machine Learning Studio.
Estimated values in one set of data may be more than or less than reference values in the other set of data. You must
produce a distribution that has a constant Type I error as a function of the correlation.
You need to produce the distribution.
Which type of distribution should you produce?
- A. Unpaired t-test with a two-tail option
- B. Unpaired t-test with a one-tail option
- C. Paired t-test with a one-tail option
- D. Paired t-test with a two-tail option
Answer:
D
Explanation:
Choose a one-tail or two-tail test. The default is a two-tailed test. This is the most common type of test, in which the expected
distribution is symmetric around zero.
Example: Type I error of unpaired and paired two-sample t-tests as a function of the correlation. The simulated random
numbers originate from a bivariate normal distribution with a variance of 1.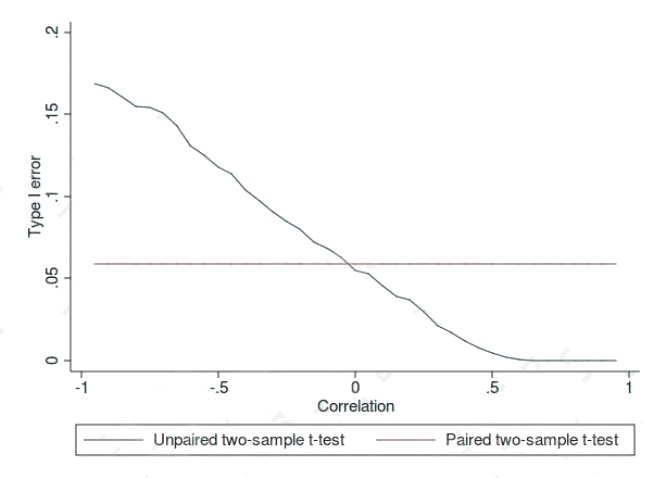
Reference:
https://docs.microsoft.com/en-us/azure/machine-learning/studio-module-reference/test-hypothesis-using-t-test
https://en.wikipedia.org/wiki/Student%27s_t-test
Question 12 Topic 3, Mixed Questions
HOTSPOT
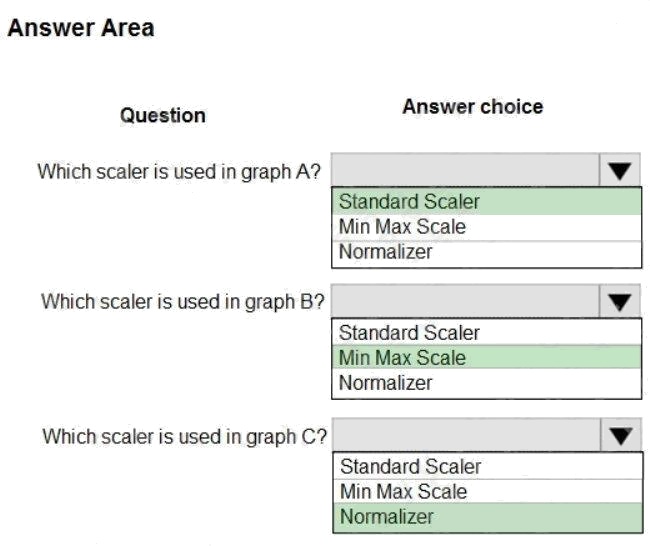
You are performing feature scaling by using the scikit-learn Python library for x.1 x2, and x3 features.
Original and scaled data is shown in the following image.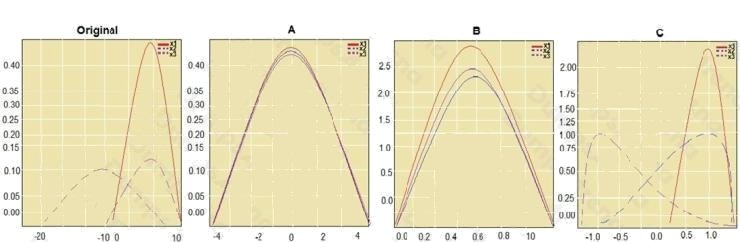
Use the drop-down menus to select the answer choice that answers each question based on the information presented in
the graphic.
NOTE: Each correct selection is worth one point.
Hot Area: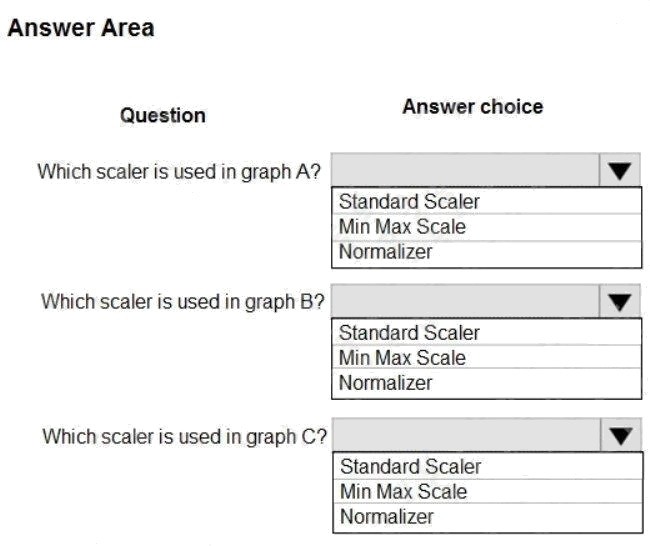
Answer:
Explanation:
Box 1: StandardScaler
The StandardScaler assumes your data is normally distributed within each feature and will scale them such that the
distribution is now centred around 0, with a standard deviation of 1. Example: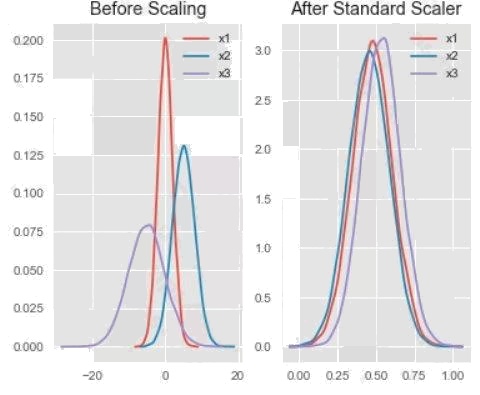
All features are now on the same scale relative to one another.
Box 2: Min Max Scaler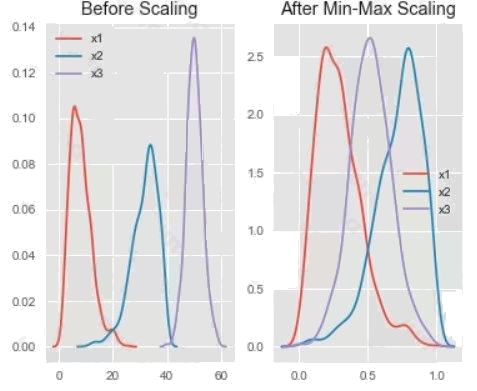
Notice that the skewness of the distribution is maintained but the 3 distributions are brought into the same scale so that they
overlap. Box 3: Normalizer
References:
http://benalexkeen.com/feature-scaling-with-scikit-learn/
Question 13 Topic 3, Mixed Questions
Note: This question is part of a series of questions that present the same scenario. Each question in the series contains a
unique solution that might meet the stated goals. Some question sets might have more than one correct solution, while
others might not have a correct solution.
After you answer a question in this section, you will NOT be able to return to it. As a result, these questions will not appear in
the review screen.
You train a classification model by using a logistic regression algorithm.
You must be able to explain the model's predictions by calculating the importance of each feature, both as an overall global
relative importance value and as a measure of local importance for a specific set of predictions.
You need to create an explainer that you can use to retrieve the required global and local feature importance values.
Solution: Create a PFIExplainer.
Does the solution meet the goal?
- A. Yes
- B. No
Answer:
A
Explanation:
Permutation Feature Importance Explainer (PFI): Permutation Feature Importance is a technique used to explain
classification and regression models. At a high level, the way it works is by randomly shuffling data one feature at a time for
the entire dataset and calculating how much the performance metric of interest changes. The larger the change, the more
important that feature is. PFI can explain the overall behavior of any underlying model but does not explain individual
predictions.
Reference: https://docs.microsoft.com/en-us/azure/machine-learning/how-to-machine-learning-interpretability
Question 14 Topic 3, Mixed Questions
Note: This question is part of a series of questions that present the same scenario. Each question in the series contains a
unique solution that might meet the stated goals. Some question sets might have more than one correct solution, while
others might not have a correct solution.
After you answer a question in this section, you will NOT be able to return to it. As a result, these questions will not appear in
the review screen.
You train a classification model by using a logistic regression algorithm.
You must be able to explain the model's predictions by calculating the importance of each feature, both as an overall global
relative importance value and as a measure of local importance for a specific set of predictions.
You need to create an explainer that you can use to retrieve the required global and local feature importance values.
Solution: Create a TabularExplainer.
Does the solution meet the goal?
- A. Yes
- B. No
Answer:
B
Explanation:
Instead use Permutation Feature Importance Explainer (PFI).
Note 1: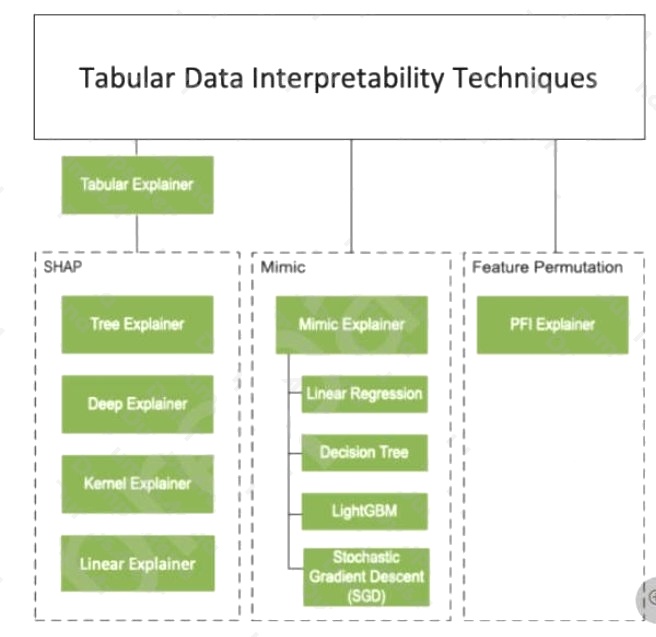
Note 2: Permutation Feature Importance Explainer (PFI): Permutation Feature Importance is a technique used to explain
classification and regression models. At a high level, the way it works is by randomly shuffling data one feature at a time for
the entire dataset and calculating how much the performance metric of interest changes. The larger the change, the more
important that feature is. PFI can explain the overall behavior of any underlying model but does not explain individual
predictions.
Reference: https://docs.microsoft.com/en-us/azure/machine-learning/how-to-machine-learning-interpretability
Question 15 Topic 3, Mixed Questions
Note: This question is part of a series of questions that present the same scenario. Each question in the series contains a
unique solution that might meet the stated goals. Some question sets might have more than one correct solution, while
others might not have a correct solution.
After you answer a question in this section, you will NOT be able to return to it. As a result, these questions will not appear in
the review screen.
You train a classification model by using a logistic regression algorithm.
You must be able to explain the model's predictions by calculating the importance of each feature, both as an overall global
relative importance value and as a measure of local importance for a specific set of predictions.
You need to create an explainer that you can use to retrieve the required global and local feature importance values.
Solution: Create a MimicExplainer.
Does the solution meet the goal?
- A. Yes
- B. No
Answer:
B
Explanation:
Instead use Permutation Feature Importance Explainer (PFI).
Note 1: Mimic explainer is based on the idea of training global surrogate models to mimic blackbox models. A global
surrogate model is an intrinsically interpretable model that is trained to approximate the predictions of any black box model
as accurately as possible. Data scientists can interpret the surrogate model to draw conclusions about the black box model.
Note 2: Permutation Feature Importance Explainer (PFI): Permutation Feature Importance is a technique used to explain
classification and regression models. At a high level, the way it works is by randomly shuffling data one feature at a time for
the entire dataset and calculating how much the performance metric of interest changes. The larger the change, the more
important that feature is. PFI can explain the overall behavior of any underlying model but does not explain individual
predictions.
Reference: https://docs.microsoft.com/en-us/azure/machine-learning/how-to-machine-learning-interpretability