microsoft da-100 practice test
Analyzing Data with Microsoft Power BI
Note: Test Case questions are at the end of the exam
Last exam update: Jun 28 ,2025
Question 1 Topic 7, Mixed Questions
Your company has a Microsoft Excel file that stores purchase data. The Excel file has a date and time column named
Date_Time. The Date_Time column contains data in the format: 2020-08-13 13:46:83
You want to use a built-in date hierarchy to analyze the purchase data by the date.
How should you prepare the data in the Date_Time column?
- A. Create a script that removes the time portion of the Date_Time column.
- B. Add a new column named Date and use regular expressions to trim the data to the first 10 characters.
- C. Add a new column named Date using the following formula: TransformColumnTypes(Source,{{"Date_Time", type datetime}})
- D. Add a new column by example that starts with 2020-08-13. Set the data type of the new column to Date.
Answer:
D
Explanation:
To use a built-in-date hierarchy, you need to set the data type of the new column to Date.
Reference: https://docs.microsoft.com/en-us/power-bi/create-reports/desktop-add-column-from-example
https://www.exceljetconsult.com.ng/home/blog/power-query-split-date-and-time-into-separate-columns/
Question 2 Topic 7, Mixed Questions
You have the tables show in the following exhibit: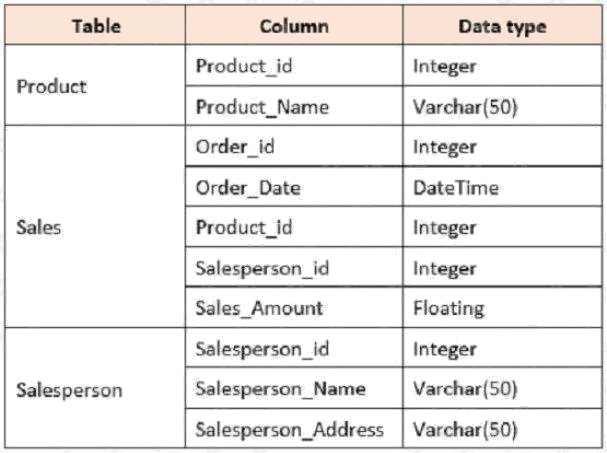
More than 10 million Sales records are generated every month.
You want to create an analytics system displays the number of sales per day, per product, and per sales person. You also
want to ensure that the data model is as small as possible.
You create the following many to one relationships:
Sales to Product
Sales to Salesperson
What should you do next?
- A. For each relationship, change the Cross filter direction to Both.
- B. Group the sales by Order_Date, Product_id, and Salesperson_id. Then aggregate by using the CountRows function.
- C. Create a new group on the Sales_Amount column and set the Group type to Bin.
- D. Create a new hierarchy that summarizes the data by the Sales_Amount column.
Answer:
B
Explanation:
References: https://docs.microsoft.com/en-us/power-bi/transform-model/desktop-create-and-manage-relationships
Question 3 Topic 7, Mixed Questions
You have a Power BI model that contains tables named Sales and Customers. The Sales and Customers tables are shown
in the exhibit: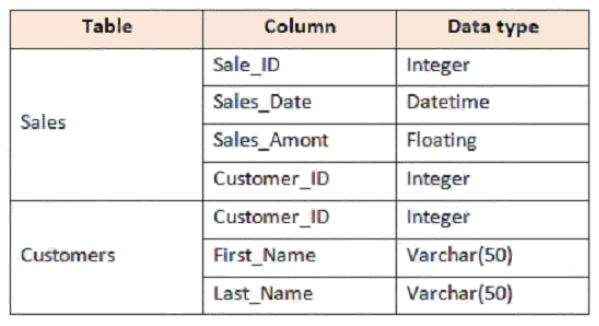
There is a relationship between the Sales and Customers tables.
The Sales table contains more than one million records.
You want to import a sample of the data from the Sales table.
What action could you take?
- A. In the Power BI model, create a calculated table.
- B. In the Power Query Editor, transform the Sales table.
- C. In the Power Query Editor, filter the Sales table by Sales_Date.
- D. In the Power Query Editor, create a column by using Column From Examples.
Answer:
C
Question 4 Topic 7, Mixed Questions
You are developing a report page in Microsoft Power BI Desktop.
Some of your users will use a screen reader to consume the report.
You want these users to consume report in a chronological order.
What action should you take?
- A. In Microsoft Power BI Desktop, configure the tab order
- B. In Microsoft Power BI Desktop, configure the layer order
- C. In Microsoft Power BI Desktop, configure the bookmark order
- D. In Microsoft Power BI Desktop, configure the sort order
Answer:
A
Explanation:
Report authors can set the tab order for objects and visuals.
References: https://powerbi.microsoft.com/en-us/blog/power-bi-desktop-december-2018-feature-summary/
https://docs.microsoft.com/en-us/power-bi/create-reports/desktop-accessibility-consuming-tools
Topic 4, Analyze the Data
Question 5 Topic 7, Mixed Questions
You are using Microsoft Power BI. You want to add multimedia objects that are published to Microsoft Stream to the Power
BI dashboard.
What action should you take?
- A. Add a Video tile
- B. Add a Custom streaming data tile
- C. Add a Web content tile
- D. Add an Image tile
Answer:
B
Explanation:
The only way to visualize a streaming dataset is to add a tile and use the streaming dataset as a custom streaming data
source.
References:
https://docs.microsoft.com/en-us/power-bi/create-reports/service-dashboard-add-widget https://docs.microsoft.com/en-
us/power-bi/connect-data/service-real-time-streaming
Question 6 Topic 7, Mixed Questions
You have a report that contains several visualizations. One of the visualizations is a KPI visualization.
You need to filter all the visualizations in the report except the KPI visualization. Which two actions should you perform?
Each correct answer is part of the solution. (Choose two.)
NOTE: Each correct selection is worth one point
- A. Add the same slicer to each page and configure Sync slicers.
- B. Edit the interactions of the KPI visualization.
- C. Configure a page-level filter.
- D. Edit the interactions of the slicer that is on the same page as the KPI visualization.
- E. Configure a report-level filter.
Answer:
A B
Explanation:
Reference: https://docs.microsoft.com/en-us/power-bi/create-reports/service-reports-visual-interactions
Question 7 Topic 7, Mixed Questions
You are creating a visual that will rank product categories by sales revenue. Your solution must ensure that data is not sent
outside of your Microsoft Power BI tenant.
What should you do?
- A. Use default or any custom visuals from the marketplace.
- B. Use default or certified custom visuals.
- C. Use default visuals or custom visuals uploaded from a .pbiviz file.
- D. Use only default visuals.
Answer:
B
Explanation:
Reference:
https://datasavvy.me/2019/02/28/what-data-is-being-sent-externally-by-power-bi-visuals/
Question 8 Topic 7, Mixed Questions
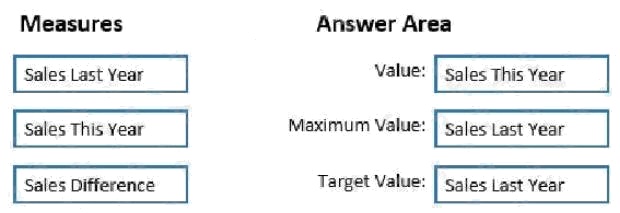
You have a Power BI model that contains a table named Sales. The Sales table has the three measures named Sales Last
Year, Sales This Year, and Sales Difference:
Sales Last Year displays the sales from the previous calendar year. The current value is 32.89 million. Sales This Year
displays the sales from the current calendar year. The current value is 11.69 million. Sales Difference uses the DAX formula
of Sales[Last Year] Sales[This Year].
You need to create the following visualization.
How should you configure the visualization? To answer, move the measures to match the fields in the answer area. Each
measure can be used once, more than once, or not at all.
NOTE: Each correct selection is worth one point.
Select and Place:
Answer:
Explanation:
References: https://docs.microsoft.com/en-us/power-bi/visuals/power-bi-visualization-radial-gauge-charts
Question 9 Topic 7, Mixed Questions
You have a dashboard that has Q&A enabled.
When a user runs the query "count of clients" in Q&A, the user does not receive any results. However, when the user runs
the query "count of subscribers", the user receives the expected results.
You want the user to receive the same results when using either query.
Which action should you take?
- A. In the dashboard, enable and configure Data classification.
- B. In your data model, add synonyms to tables and columns.
- C. In Power BI, create featured questions.
- D. Add a description of "subscribers" to the dashboard.
Answer:
B
Explanation:
You can add synonyms to tables and columns.
Note: This step applies specifically to Q&A (and not to Power BI reports in general). Users often have a variety of terms they
use to refer to the same thing, such as total sales, net sales, total net sales. You can add these synonyms to tables and
columns in the Power BI model.
This step applies specifically to Q&A (and not to Power BI reports in general). Users often have a variety of terms they use to
refer to the same thing, such as total sales, net sales, total net sales. You can add these synonyms to tables and columns in
the Power BI model.
References:
https://docs.microsoft.com/en-us/power-bi/natural-language/q-and-a-best-practices
Question 10 Topic 7, Mixed Questions
You have a Microsoft Excel spreadsheet that contains a table named Sales.
You want to add the Sales table to a Power BI dashboard as a tile.
How should you configure the tile?
- A. From the Power BI service, import the data from the Excel workbook.
- B. From Excel, publish the workbook to the Power BI service.
- C. From the Power BI tab in Excel, pin the table.
- D. From the Power BI service, upload the Excel workbook.
Answer:
C
Explanation:
References: https://docs.microsoft.com/en-us/power-bi/collaborate-share/service-analyze-in-excel
Question 11 Topic 7, Mixed Questions
You have a workspace that contains a dashboard named Sales Data. The Sales Data dashboard displays data from two
datasets.
Users complain that natural language queries on the dashboard often returns on results.
You want users to be able find data by using natural language queries.
You open the properties of the Sales Data dashboard, modify the Q&A settings.
Does this action allow users to find data by using natural language queries?
- A. Yes, it does
- B. No, it does not
Answer:
B
Explanation:
References: https://docs.microsoft.com/en-us/power-bi/create-reports/service-q-and-a-direct-query
Question 12 Topic 7, Mixed Questions
You have a workspace that contains a dashboard named Sales Data. The Sales Data dashboard displays data from two
datasets.
Users complain that natural language queries on the dashboard often returns on results.
You want users to be able find data by using natural language queries.
You open the properties of the datasets and modify the Q&A and Cortana settings.
Does this action allow users to find data by using natural language queries?
- A. Yes, it does
- B. No, it does not
Answer:
A
Explanation:
References: https://docs.microsoft.com/en-us/power-bi/create-reports/service-q-and-a-direct-query
Question 13 Topic 7, Mixed Questions
You have a workspace that contains a dashboard named Sales Data. The Sales Data dashboard displays data from two
datasets.
Users complain that natural language queries on the dashboard often returns on results.
You want users to be able find data by using natural language queries.
You open the settings of the workspace and modify the Language Settings.
Does this action allow users to find data by using natural language queries?
- A. Yes, it does
- B. No, it does not
Answer:
B
Explanation:
References: https://docs.microsoft.com/en-us/power-bi/create-reports/service-q-and-a-direct-query
Question 14 Topic 7, Mixed Questions
You have several Power BI visualizations that you want to embed in a public website.
Which two visualizations can you embed into the website?
NOTE: Each correct selection is worth one point.
- A. Visualizations that use row-level security (RLS)
- B. Visualizations that use datasets stored in Microsoft OneDrive for Business
- C. Custom visualizations
- D. Visualizations that contain reports shared to your user account
- E. Q&A for Power BI visuals
- F. Visualizations that use report-level DAX measures.
Answer:
B C
Explanation:
References: https://docs.microsoft.com/en-us/power-bi/service-publish-to-web
Question 15 Topic 7, Mixed Questions
You have five sales office. Each office has a single sales person.
You have an imported dataset that has a dynamic row-level security (RLS) role named Sales. The Sales role filters sales
transaction data by the sales person. Each sales person must see only the data from their office.
You publish the dataset to the company website, set RLS role membership, and distribute the dataset and related reports to
the sales persons.
A sales person reports that data is missing from the dataset that she can view.
You need to verify what data the salesperson currently sees.
What should you do?
- A. Use the Test as role option to view data as the salesperson's user account.
- B. Filter the data in the reports to match the intended logic in the filter on the sales transaction table.
- C. Instruct the salesperson to open the report in Microsoft Power BI Desktop.
- D. Use the Test as role option to view data as the Sales role.
Answer:
D
Explanation:
Reference:
https://www.sqlshack.com/introduction-to-row-level-security-in-power-bi/
Topic 3, Visualize the Data