Question 1 Topic 5, Case Study 5Case Study Question View Case
Which two types of visualizations can be used in the balance sheet reports to meet the reporting goals? Each correct answer
presents part of the solution.
NOTE: Each correct selection is worth one point.
- A. a line chart that shows balances by quarter filtered to account categories that are long-term liabilities.
- B. a clustered column chart that shows balances by date (x-axis) and account category (legend) without filters.
- C. a clustered column chart that shows balances by quarter filtered to account categories that are long-term liabilities.
- D. a pie chart that shows balances by account category without filters.
- E. a ribbon chart that shows balances by quarter and accounts in the legend.
Answer:
A C
Comments
Question 2 Topic 6, Case Study 6Case Study Question View Case
HOTSPOT
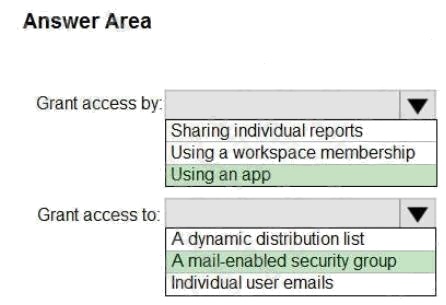
How should you distribute the reports to the board? To answer, select the appropriate options in the answer area.
NOTE: Each correct selection is worth one point.
Hot Area: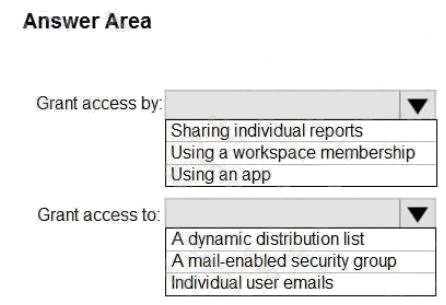
Answer:
Explanation:
Box 1: Using an app Scenario:
The company wants to provide a single package of reports to the board that contains custom navigation and links to
supplementary information.
Box 2: A mail-enabled security group Scenario: Security Requirements
The reports must be made available to the board from powerbi.com. A mail-enabled security group will be used to share
information with the board.
Reference: https://docs.microsoft.com/en-us/power-bi/admin/service-admin-rls#using-rls-with-workspaces-in-power-bi
Comments
Question 3 Topic 6, Case Study 6Case Study Question View Case
HOTSPOT
You need to grant access to the business unit analysts.
What should you configure? To answer, select the appropriate options in the answer area.
NOTE: Each correct selection is worth one point.
Hot Area:
Answer:

Explanation:
Box 1: The Viewer role to the workspace
The Viewer role gives a read-only experience to its users. They can view dashboards, reports, or workbooks in the
workspace, but cant browse the datasets or dataflows. Use the Viewer role wherever you would previously use a classic
workspace set to Members can only view Power BI content.
Box 2: Build
The analysts must be able to build new reports from the dataset that contains the profit and loss data.
Scenario: The reports must be made available to the board from powerbi.com.
The analysts responsible for each business unit must see all the data the board sees, except the profit and loss data, which
must be restricted to only their business unit's data. The analysts must be able to build new reports from the dataset that
contains the profit and loss data, but any reports that the analysts build must not be included in the quarterly reports for the
board. The analysts must not be able to share the quarterly reports with anyone.
Reference: https://www.nickyvv.com/2019/08/the-new-power-bi-workspace-viewer-role-explained.html
Deploy and Maintain Deliverables
Comments
Question 4 Topic 7, Mixed Questions
What is the minimum number of Power BI datasets needed to support the reports?
- A. two imported datasets
- B. a single DirectQuery dataset
- C. two DirectQuery datasets
- D. a single imported dataset
Answer:
A
Explanation:
Scenario: Data and Sources
Data for the reports comes from three sources. Detailed revenue, cost, and expense data comes from an Azure SQL
database. Summary balance sheet data comes from Microsoft Dynamics 365 Business Central. The balance sheet data is
not related to the profit and loss results, other than they both relate dates.
Monthly revenue and expense projections for the next quarter come from a Microsoft SharePoint Online list. Quarterly
projections relate to the profit and loss results by using the following shared dimensions: date, business unit, department,
and product category.
Reference: https://docs.microsoft.com/en-us/power-bi/connect-data/service-datasets-understand
Comments
Question 5 Topic 7, Mixed Questions
You have a custom connector that returns ID, From, To, Subject, Body, and Has Attachments for every email sent during the
past year. More than 10 million records are returned.
You build a report analyzing the internal networks of employees based on whom they send emails to.
You need to prevent report recipients from reading the analyzed emails. The solution must minimize the model size.
What should you do?
- A. Implement row-level security (RLS) so that the report recipients can only see results based on the emails they sent.
- B. Remove the Subject and Body columns during the import.
- C. From Model view, set the Subject and Body columns to Hidden.
Answer:
B
Explanation:
Incorrect Answers:
A, C: Does not reduce the size of the model.
Comments
Question 6 Topic 7, Mixed Questions
You have the tables shown in the following table.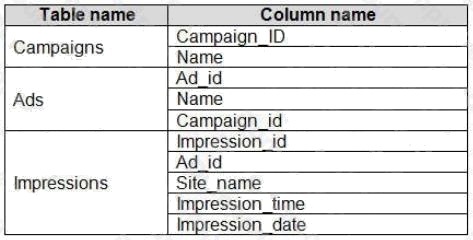
The Impressions table contains approximately 30 million records per month.
You need to create an ad analytics system to meet the following requirements:
Present ad impression counts for the day, campaign, and Site_name. The analytics for the last year are required.

Minimize the data model size.
Which two actions should you perform? Each correct answer presents part of the solution.
NOTE: Each correct selection is worth one point.
- A. Group the impressions by Ad_id, Site_name, and Impression_date. Aggregate by using the CountRows function.
- B. Create one-to-many relationships between the tables.
- C. Create a calculated measure that aggregates by using the COUNTROWS function.
- D. Create a calculated table that contains Ad_id, Site_name, and Impression_date.
Answer:
A B
Comments
Question 7 Topic 7, Mixed Questions
Your company has training videos that are published to Microsoft Stream.
You need to surface the videos directly in a Microsoft Power BI dashboard.
Which type of tile should you add?
- A. video
- B. custom streaming data
- C. text box
- D. web content
Answer:
B
Explanation:
The only way to visualize a streaming dataset is to add a tile and use the streaming dataset as a custom streaming data
source.
Reference:
https://docs.microsoft.com/en-us/power-bi/connect-data/service-real-time-streaming
Comments
Question 8 Topic 7, Mixed Questions
You open a query in Power Query Editor.
You need to identify the percentage of empty values in each column as quickly as possible.
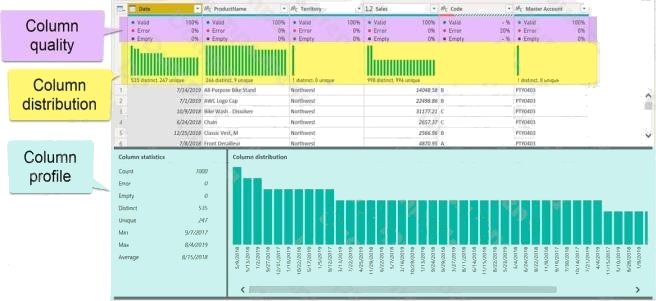
Which Data Preview option should you select?
- A. Show whitespace
- B. Column profile
- C. Column distribution
- D. Column quality
Answer:
D
Explanation:
Column quality: In this section, we can easily see valid, Error and Empty percentage of data values associated with the
Selected table.
Note: In Power Query Editor, Under View tab in Data Preview Section we can see the following data profiling functionalities:
Column quality
Column distribution Column profile

Reference: https://community.powerbi.com/t5/Community-Blog/Data-Profiling-in-Power-BI-Power-BI-Update-April-2019/ba-
p/674555
Comments
Question 9 Topic 7, Mixed Questions
You have a prospective customer list that contains 1,500 rows of data. The list contains the following fields:
First name
Last name
Email address
State/Region
Phone number
You import the list into Power Query Editor.
You need to ensure that the list contains records for each State/Region to which you want to target a marketing campaign.
Which two actions should you perform? Each correct answer presents part of the solution.
NOTE: Each correct selection is worth one point.
- A. Open the Advanced Editor.
- B. Select Column quality.
- C. Enable Column profiling based on entire dataset.
- D. Select Column distribution.
- E. Select Column profile.
Answer:
D E
Explanation:
Data Profiling, Quality & Distribution in Power BI / Power Query features
To enable these features, you need to go to the View tab Data Preview Group Check the following:
Column quality
Column profile
Column distribution
Column profile
Turn on the Column Profiling feature.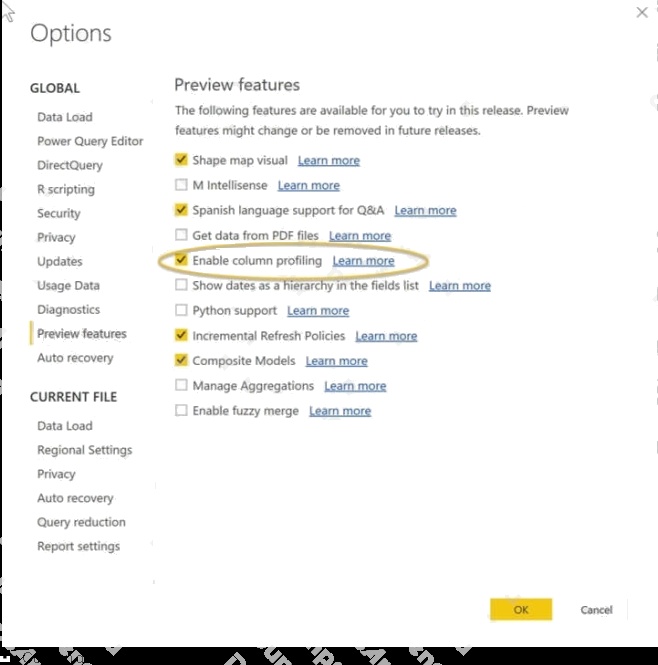
Can use it to visually realize that your query is missing some data because of distinct and uniqueness counts.
Reference:
https://www.poweredsolutions.co/2019/08/13/data-profiling-quality-distribution-in-power-bi-power-query/
https://www.altentertraining.com/microsoft/power-bi/column-profiling-is-good/
Comments
Question 10 Topic 7, Mixed Questions
HOTSPOT
You have an API that returns more than 100 columns. The following is a sample of column names.
client_notified_timestamp client_notified_source client_notified_sourceid client_notified_value


client_responded_timestamp client_responded_source client_responded_sourceid client_responded_value


You plan to include only a subset of the returned columns.
You need to remove any columns that have a suffix of sourceid.
How should you complete the Power Query M code? To answer, select the appropriate options in the answer area.
NOTE: Each correct selection is worth one point.
Hot Area:
Answer:

Explanation:
Box 1: Table.RemoveColumns
When you do Remove Columns Power Query uses the Table.RemoveColumns function
Box 2: List.Select Get a list of columns.
Box 3: Text.Contains
Example code to remove columns with a slash (/): let
Source = Excel.Workbook(File.Contents("C: Source"), null, true),
#"1_Sheet" = Source{[Item="1",Kind="Sheet"]}[Data],
#"Promoted Headers" = Table.PromoteHeaders(#"1_Sheet", [PromoteAllScalars=true]),
// get columns which contains any slash among values
ColumnsToRemove =
List.Select(
// get a list of all columns
Table.ColumnNames(#"Promoted Headers"),
(columnName) =>
let
// get all values of a columns
ColumnValues = Table.Column(#"Promoted Headers", columnName),
// go through values and stop when you find the first occurence of a text containing a slash // if there is a value with a slash,
return true else false
ContainsSlash = List.AnyTrue(List.Transform(ColumnValues, each Text.Contains(_, "/"))) in
ContainsSlash
),
// remove columns
Result = Table.RemoveColumns(#"Promoted Headers", ColumnsToRemove) in
Result
Reference: https://community.powerbi.com/t5/Power-Query/Remove-columns-containing-a-certain-value/td-p/759657
Comments
Page 1 out of 14
Viewing questions 1-10 out of 143
page 2