google looker business analyst practice test
Looker Business Analyst
Last exam update: Jun 27 ,2025
Question 1
The query below shows how many uses purchased an item from each of two clothing departments.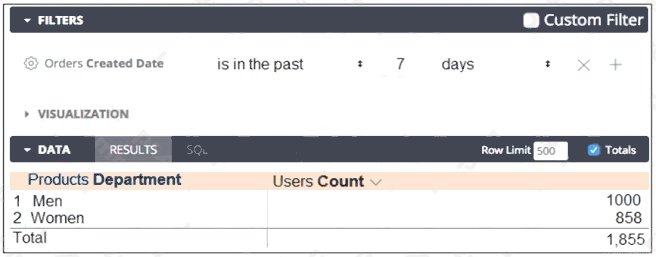
Why are the total and sum of the rows unequal?
- A. There is a filter limiting the count in the Total row.
- B. There is a faulty logic in the way users relate to clothing departments.
- C. A user is only counted once in the total even if the user has purchased from both departments.
- D. There are users who have never purchased a clothing item from either department.
Answer:
C
Question 2
An analyst creates a table visualization. There is one dimension, a few count type measures, and a percentage table
calculation. When the analyst tries to download all 200,000 rows of results in CSV, the option is unavailable. The analyst has
been provided permission to download all results.
Which action should the analyst take to download all results?
- A. Request that the admin user download this Look and share the file.
- B. Change the table calculation to use an offset() function.
- C. Contact the developer to create the percentage as a measure.
- D. Apply a custom limit to the download.
Answer:
D
Question 3
An analyst needs to compare monthly sales, year over year, based on when an order was created, as shown in the exhibit.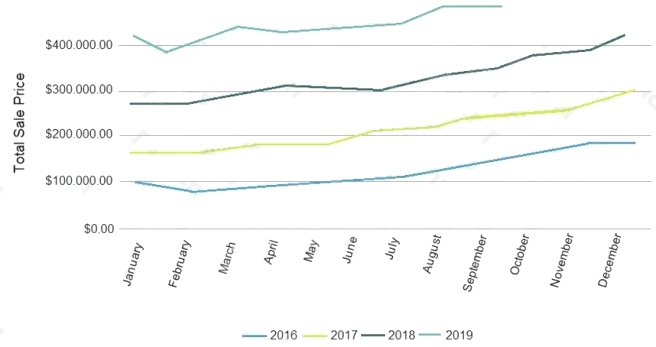
How should the analyst, in addition to selecting the measure Total Sales build the report?
- A. Select the dimension Created Month, and pivot on the dimension Created Year.
- B. Select the dimension Created Year, and pivot on the dimension Created Month.
- C. Select the dimension Created Month Name, and pivot on the dimension Created Year.
- D. Select the dimension Created Year, and pivot on the dimension Created Month Name.
Answer:
A
Question 4
An analyst adds a Day dimension and a Signup Count measure to an Explore to show the number of new users added per
day. The analyst wants to add a metric that increases by the number of new users per day, on a rolling basis.
How should that metric be calculated?
- A. Add a Sum measure to the Explore and re-run the query.
- B. Add a table calculation that calls running_portal (${users.signup_count})
- C. Add a custom measure of type: running_total
- D. Add a table calculation that calls ${users.signup_count:total}
Answer:
A
Explanation:
Reference: https://help.looker.com/hc/en-us/articles/360023904433-Using-datagroups-with-Cascading-PDTs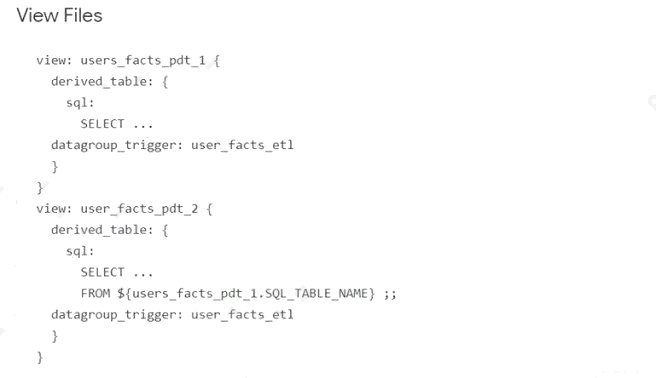
Question 5
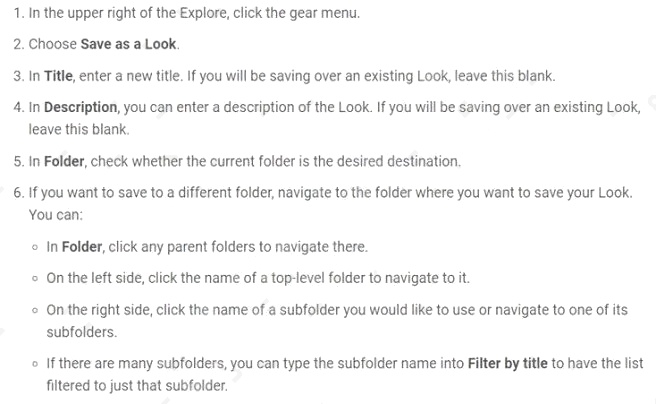
Users find it difficult to distinguish the dashboards they need for tracking sales performance. There are more than 30
operation-related dashboards in the same folder.
What should the analyst do to improve the navigation experience?
- A. Pin the dashboards into boards and grant user access to the individual dashboards.
- B. Add descriptions to the dashboards to give more details.
- C. Sort the dashboards in the folder by name.
- D. Show the dashboards in a grid style for displaying the snapshot.
Answer:
C
Question 6
A company has an operational dashboard that needs to display the latest data every 5 minutes on a monitor.
How should the analyst configure the dashboard?
- A. Set the dashboard schedule to run every 5 minutes.
- B. Set the dashboard auto refresh to 5 minutes.
- C. Set the dashboard to run on load every 5 minutes.
- D. Set the dashboard schedule to 5 minutes and “send if the results have changed”.
Answer:
A
Explanation:
Reference: https://help.singlecomm.com/hc/en-us/articles/115010227127-Standard-Dashboards
Question 7
A business analyst is creating an Explore that shows the number of hotel rooms booked per week, by room type. The analyst
is using a Week dimension and a Count measure, and is provisioning on a Room Type dimension. Looking at the results, the
Count of King rooms seems unusually low one week.
What should the analyst do to further investigate the low numbers?
- A. Run the Explore again to make sure the results are the same.
- B. Click on the Count measure where it is low to drill in to it.
- C. Click on the Room Type dimension where it is King to drill in to it.
- D. Remove the pivot on the Room Type dimension and re-run the Explore.
Answer:
B
Question 8
Two weeks into the third quarter, an analyst needs to determine the total order count per month for only the first two
quarters.
How should the analyst filter the query?
- A. Created Month “is in the first 2 quarters”
- B. Created Month “is in the past 2 complete quarters”
- C. Created Month “is in the past 2 quarters”
- D. Created Month “is in the last 6 months”
Answer:
C
Question 9
A company has a Customer Lookup dashboard that can be filtered on a unique customer name. Business users sometimes
report unexpected data when they use filters with starts with or contains for the customer name.
How should the analyst ensure that the filter is unique to one customer?
- A. Change the filter type to string.
- B. Enable the setting Limit one filter value.
- C. Use the Matches Advanced filtering option.
- D. Disable the setting Allow multiple filter values.
Answer:
D
Question 10
A business analyst is building a report of predicted sales. The business analyst wants to filter the results to only show dates
in the next seven days. This filter should work whenever the results are generated.
Which filter expression should the business analyst use?
- A. 7 days from now
- B. After Today’s Date for 7 days
- C. Today for 7 days
- D. For 7 days
Answer:
B
Question 11
An analyst needs to analyze the ecommerce quarter-over-quarter order growth. Two fields are given: Order Created Quarter
and Order Count.
Which table calculation function should the analyst use to calculate the quarter-over-quarter order growth?
- A. pivot_offset()
- B. lookup()
- C. offset_list()
- D. offset()
Answer:
D
Explanation:
Reference: https://help.looker.com/hc/en-us/articles/360023509454-Calculating-Percent-of-Previous-and-Percent-Change-
with-Table-Calculations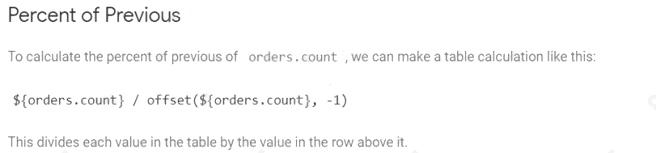
Question 12
An analyst creates a column chart showing the count of total orders and the count of returned orders on each date. The
number of returned orders is much smaller than the number of total orders, so the columns for the returned orders are short
and it is difficult to compare all the columns visually.
How should the analyst ensure that the differences between returned order counts for each day are more visible?
- A. Change the returned orders series to a line type.
- B. Move the returned orders series to a new right axis.
- C. Change the y-axis height to a higher number of pixels.
- D. Set the x-axis to use a log scale.
Answer:
C
Question 13
An analyst for a movie producer is making an Explore query to show total box office revenue by movie. The initial query has
three dimensions:
Ticket Purchase Month
Movie Name
Ticket Revenue
The analyst notices that the numbers look a lot smaller than expected and the results are difficult to understand.
What should the analyst do to make the Explore query show the desired metric?
- A. Remove the Month dimension and the Ticket Revenue dimension from the query. Add the Sum Revenue measure.
- B. Remove the Ticket Revenue dimension from the query. Add the Sum Revenue measure.
- C. Add the Sum Revenue measure to the query.
- D. Add a table calculation that sums the Ticket Revenue dimension.
Answer:
C
Question 14
An analyst needs to select all users in the query results but only wants to visualize results for users that have more than 100
orders.
Which visualization option should the analyst utilize?
- A. Right-click to hide unwanted rows.
- B. Limit displayed rows.
- C. Use a custom filter.
- D. Hide rows with table calculations.
Answer:
B
Explanation:
Reference: https://docs.looker.com/exploring-data/filtering-and-limiting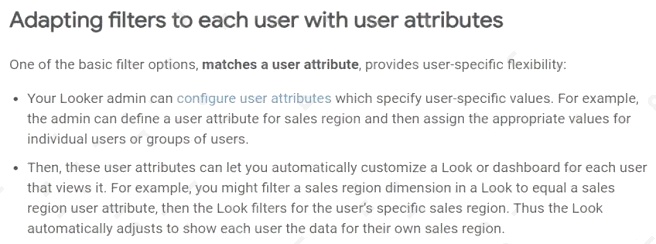
Question 15
An analyst needs to display data from two different sources together. There is a Look for each data source, but there is no
shared field that can be combined. Both Looks are saved in the Shared folder.
How should the analyst display the data from both sources?
- A. use Merged Results to combine the data sources.
- B. Ask the LookML developer to build a new Explore.
- C. Add both Looks to a dashboard
- D. Pin both Looks to a board.
Answer:
C
Explanation:
Reference: https://docs.looker.com/exploring-data/saving-and-editing-looks