Question 1
Multi-voting Is frequently used in which of the following steps of the quality Improvement process?
- A. identifying root causes
- B. speculating on problem causes
- C. prioritizing Improvement opportunities
- D. Implementing solutions and controls
Answer:
C
Explanation:
Multi-voting is a technique that helps a group narrow down a large list of options to a smaller list of
the most important or preferred ones. It is also known as NGT voting or nominal prioritization 1.
Multi-voting is frequently used in the quality improvement process when there are many potential
problems or solutions to choose from, and the group needs to focus on the most critical or feasible
ones. It can help the group reach a consensus and avoid bias or domination by a few members 1.
According to the NAHQ Healthcare Quality Competency Framework, one of the skills required for
healthcare quality professionals is to “use multi-voting to prioritize improvement
opportunities” 2. This skill belongs to the domain of performance and process improvement, which
involves identifying, analyzing, and implementing changes to improve outcomes and efficiency 3.
The steps of multi-voting are as follows 1:
Generate a list of options or ideas using brainstorming, affinity diagram, or other methods.
Display thelist on a flip chart, whiteboard, or computer screen so that everyone can see it.
Ask each group member to select a certain number of options (usually 3 to 5) that they think are the
most important or relevant. They can use stickers, dots, or marks to indicate their choices.
Count the number of votes for each option and rank them from the highest to the lowest.
Eliminate the options that received the least votes (usually less than half of the highest vote) and
repeat the voting process with the remaining options until the desired number of options is reached
(usually 3 to 5).
Discuss the final list of options and agree on the priority order or the final selection. Reference:
2: NAHQ Healthcare Quality Competency Framework, Domain 3: Performance and Process
Improvement, Skill 3.1.4
3: NAHQ Healthcare Quality Competency Framework Overview 4
1: What is Multivoting? NGT Voting, Nominal Prioritization | ASQ 1
Comments
Question 2
An organization Is tracking Infection rates to determine the benchmarks for the next fiscal year. The
team Is analyzing the data for Infection rates. Which key variables are missing to interpret the graph?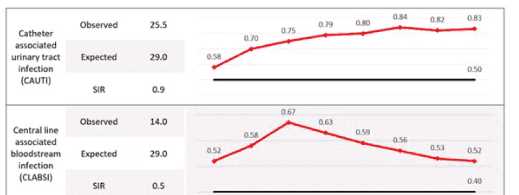
- A. the standardized infection ratio for the previous year and denominator for each measure
- B. the timeframe for each data point andthe source (or the target line
- C. the mode of the data points and expected rate for external hospitals
- D. the quality of patients and hospital compliance with handwashing
Answer:
B
Explanation:
The question pertains to key variables missing in a graph that tracks infection rates for benchmarking
purposes. The options provided suggest various combinations of data that could potentially be
missing, impacting the interpretation of the graph.
Option A suggests a need for historical data and specific denominators, but it doesn’t address
immediate contextual needs like timeframe or source/target lines.
Option C introduces external hospital expected rates and modes of data points, which might not be
directly relevant to interpreting a specific organization’s infection rate trends.
Option D focuses on qualitative aspects like patient quality and compliance with handwashing
protocols, which are essential but not directly related to interpreting graphical data.
Option B is verified as correct because it highlights two critical elements: “the timeframe for each
data point” and “the source (or target line).” These elements are fundamental to understanding any
graph as they provide context regarding when the data was collected and what benchmarks or
standards are being compared against.
The timeframe is essential to identify trends over time, seasonal variations, or impacts of specific
interventions or changes in practice.
The source or target line provides a benchmark indicating expected performance levels or goals that
the organization aims to achieve.
Without these two pieces of information, it would be challenging to derive meaningful insights from
the graph about infection rate trends and their implications for future benchmarks.
Reference:
HQ Solutions: Resource for the Healthcare Quality Professional, Fifth Edition, Chapter 5: Quality
Review and Accountability, p. 133-134
Learning Lab: Survey Readiness – A Team Approach to Success, Slide 8: Data Display
Learning Lab: The Role of the Healthcare Quality Professional in Population Health Management,
Slide 10: Data Visualization
Comments
Question 3
In order to make effective long-term changes, performance Improvement emphasizes the need to
study and understand
- A. outcomes.
- B. statistics.
- C. standards.
- D. processes.
Answer:
D
Explanation:
Performance improvement (PI) is the continuous study and improvement of processes with the
intent to better services or outcomes, and prevent or decrease the likelihood of problems, by
identifying areas of opportunity and testing new approaches to fix underlying causes of
persistent/systemic problems or barriers to improvement1.
PI is based on the assumption that most problems are related to the processes rather than the
people who perform them2. Therefore, studying and understanding the processes that deliver the
services or outcomes is essential to identify the root causes of problems, the gaps between current
and desired performance, and the potential solutions to improve them34.
PI uses various methods and tools to analyze and measure processes, such as flowcharts, process
maps, cause-and-effect diagrams, Pareto charts, histograms, control charts, run charts, and scatter
diagrams5. These tools help to visualize the steps, inputs, outputs, and variations of a process, and to
monitor and evaluate its performance over time6.
PI also uses various models and frameworks to guide and accelerate improvement work, such as the
Model for Improvement, Plan-Do-Study-Act (PDSA) cycles, Lean, Six Sigma, and Total
QualityManagement (TQM)7. These models and frameworks help to define the aim, the measures,
and the changes for improvement, and to test and implement them in a systematic and iterative
way8.
Therefore, in order to make effective long-term changes, PI emphasizes the need to study and
understand the processes that produce the services or outcomes, as this will help to identify and
address the sources of variation, waste, and inefficiency, and to achieve better quality, safety, equity,
value, and system sustainability9 . Reference: 1: QAPI Description and Background | CMS 2: Basics of
Quality Improvement | AAFP 3: How to Improve: Model for Improvement | Institute for Healthcare
Improvement 4: Performance Management and Quality Improvement - CDC 5: [Tools for Quality
Improvement | NAHQ] 6: [Quality Improvement Tools and Methods | Agency for Healthcare
Research and Quality] 7: [Quality Improvement Models and Frameworks | NAHQ] 8: [Quality
Improvement Essentials Toolkit | Institute for Healthcare Improvement] 9: [Healthcare Quality and
Safety Workforce Report: New Imperatives for Quality and Safety Mean New Imperatives for
Workforce Development | NAHQ] : [The Financial Case for Quality as a Business Strategy | NAHQ] :
[Tools for Quality Improvement | NAHQ] : [Quality Improvement Tools and Methods | Agency for
Healthcare Research and Quality] : [Quality Improvement Models and Frameworks | NAHQ] :
[Quality Improvement Essentials Toolkit | Institute for Healthcare Improvement] : [Healthcare
Quality and Safety Workforce Report: New Imperatives for Quality and Safety Mean New Imperatives
for Workforce Development | NAHQ] : [The Financial Case for Quality as a Business Strategy | NAHQ]
: Tools for Quality Improvement | NAHQ : Quality Improvement Tools and Methods | Agency for
Healthcare Research and Quality
Comments
Question 4
A patient safety manager provided training on hand hygiene guidelines. The clinical manager Is
confident that staff are following the guidelines. Which of the following Is the best method to
evaluate the current compliance with the guidelines?
- A. collection of bacterial hand cultures
- B. direct observation of staff
- C. calculation of Infection rates compared to a baseline
- D. a test with a passing score of 98%
Answer:
B
Explanation:
According to the WHO Guidelines on Hand Hygiene in Health Care, direct observation of hand
hygiene practices is the gold standard for measuring compliance1. Direct observation allows for the
assessment of the five moments of hand hygiene, the use of appropriate technique, and the
identification of barriers and facilitators to adherence1.
Direct observation also provides an opportunity for immediate feedback and education to the health
care workers, which can improve their knowledge and motivation to perform hand hygiene2. Direct
observation can be done covertly or overtly, depending on the purpose and context of the audit2.
Other methods of measuring hand hygiene compliance, such as collection of bacterial hand cultures,
calculation of infection rates, or a test with a passing score, have limitations and disadvantages. For
example, bacterial hand cultures may not reflect the actual transmission of pathogens, infection
rates may be influenced by many factors other than hand hygiene, and a test score may not correlate
with actual behavior2. Reference: 1: WHO Guidelines on Hand Hygiene in Health Care, WHO, 2009 2:
Hand Hygiene:Education, Monitoring and Feedback, CDC, 2019
Comments
Question 5
A long-term care facility Is Interested in analyzing data to determine If there Is arelationship between
the number of medications residents are prescribed and the number of falls the residents
experience. Which of the following quality tools Is most appropriate to help the long-term care
facility understand the data?
- A. Pareto chart
- B. fishbone diagram
- C. histogram
- D. chatter diagram
Answer:
D
Explanation:
A scatter diagram is a graphical tool that displays the relationship between two variables by plotting
pairs of data points on a coordinate plane. It can help identify possible correlations, trends, outliers,
and patterns in the data.
A Pareto chart is a type of bar chart that shows the frequency or impact of different factors or causes
in descending order, along with a cumulative line that indicates the percentage of the total. It can
help prioritize the most significant issues or opportunities for improvement.
A fishbone diagram is a visual tool that helps identify the root causes of a problem or effect by
organizing possible factors into categories, such as people, process, environment, etc. It can help
facilitate brainstorming and root cause analysis.
A histogram is a type of bar chart that shows the distribution of a continuous variable by grouping
the data into bins of equal width and displaying the frequency or count of each bin. It can help
describe the shape, center, spread, and outliers of the data.
In this case, the long-term care facility wants to analyze the relationship between two variables: the
number of medications and the number of falls. Therefore, a scatter diagram is the most appropriate
tool to help them understand the data. A scatter diagram can show if there is a positive, negative, or
no correlation between the two variables, and how strong or weak the correlation is. It can also
reveal any outliers or clusters of data points that may indicate other factors affecting the relationship.
A Pareto chart, a fishbone diagram, and a histogram are not suitable tools for this purpose, as they
do not show the relationship between two variables. A Pareto chart can show the relative
importance of different factors or causes, but not how they are related to each other. A fishbone
diagram can help identify the possible causes of a problem or effect, but not how they are
quantitatively related to each other. A histogram can show the distribution of a single variable, but
not how it is influenced by another variable.
Reference:
NAHQ Learning Lab: The Role of the Healthcare Quality Professional in Population Health
Management, Module 3: Data Collection and Analysis, Slide 17: Scatter Diagram
NAHQ HQ Principles, Module 2: Data Management, Lesson 2.3: Data Analysis Tools, Topic 2.3.4:
Scatter Diagram
NAHQ Journal for Healthcare Quality, Volume 42, Issue 5, September/October 2020, Article:
Utilization of Improvement Methodologies by Healthcare Quality Professionals During the COVID-19
Pandemic, Page 284: Figure 2. Scatterplot of COVID-19 Cases and Deaths by State as of June 30, 2020
Comments
Question 6
In a confidential reporting system, the reporter's Identity Is
- A. hidden from authorities.
- B. known to legal authorities.
- C. known to regulatory groups.
- D. hidden from everyone.
Answer:
A
Explanation:
A confidential reporting system is a voluntary system that allows healthcare professionals to report
patient safety incidents or nearmisses without fear of legal or professional repercussions12.
The purpose of a confidential reporting system is to enhance the data available to assess and resolve
patient safety and quality issues, and to encourage the reporting and analysis of medical errors12.
A confidential reporting system is different from an anonymous reporting system, where the
reporter’s identity is unknown, or a nonconfidential reporting system, where the reporter’s identity
is disclosed3.
In a confidential reporting system, the reporter’s identity is hidden from authorities, such as legal
authorities, regulatory groups, or the public12. However, the reporter’s identity may be known to
the entity that operates the reporting system, such as a patient safety organization (PSO) or a
healthcare organization12.
The reporter’s identity is protected by federal privilege and confidentiality protections under the
Patient Safety and Quality Improvement Act of 2005 (PSQIA)12. This means that the reporter’s
identity and the information reported cannot be used for legal or regulatory purposes, or disclosed
to anyone without the reporter’s consent12.
Therefore, the correct answer is A. hidden from authorities, because in a confidential reporting
system, the reporter’s identity is not revealed to anyone outside the reporting system, unless the
reporter agrees to do so. Reference: 1: Understanding Patient Safety Confidentiality 2: Confidential
Physician Feedback Reports: Designing for Optimal Impact on Performance 3: Quality - Safety &
Confidentiality - General - AIHC
Comments
Question 7
A quality improvement professional believes that their MRSA facility rates are high. What should the
quality improvement professional do first?
- A. Contact the infection control practitioner to obtainbenchmark data.
- B. Report the concerns to senior management and the Quality Council.
- C. Form a quality improvement team.
- D. Repeat the data collection process to Justify the new rate.
Answer:
A
Explanation:
The first step for a quality improvement professional who believes that their MRSA facility rates are
high is to contact the infection control practitioner to obtain benchmark data. Benchmark data are
comparative data that can help identify gaps in performance and set realistic and achievable goals
for improvement 1. Benchmark data can be obtained from various sources, such as national or
regional databases, professional organizations, peer-reviewed literature, or other similar facilities 2.
By contacting the infection control practitioner, the quality improvement professional can access
reliable and valid data on MRSA rates in their facility and compare them with other facilities or
standards. This can help them determine the magnitude and significance of the problem, and
whether it warrants further investigation and action. The infection control practitioner can also
provide guidance on the best practices and protocols for preventing and controlling MRSA infections,
and the potential risk factors and causes of high MRSA rates 3.
The other options are not the best first steps for the quality improvement professional. Reporting the
concerns to senior management and the Quality Council (option B) may be premature and
unnecessary without having sufficient evidence and analysis of the problem. Forming a quality
improvement team (option C) may be helpful later in the process, but not before defining and
measuring the problem. Repeating the data collection process to justify the new rate (option D) may
be wasteful and inaccurate, as it may not account for the variability and trends in the data, and it may
not address the underlying causes of the problem . Reference:
1: NAHQ Healthcare Quality Competency Framework, Domain 5: Data Analytics, Skill 5.1.1
2: Benchmarking in Healthcare: A Practical Approach | NAHQ
3: Success and failures in MRSA infection control during the COVID-19 pandemic | Antimicrobial
Resistance & Infection Control | Full Text 2
NAHQ Healthcare Quality Competency Framework, Domain 3: Performance and Process
Improvement, Skill 3.1.1
Comments
Question 8
The desired outcome of peer review Is to
- A. evaluate process Improvement Initiatives.
- B. compare provider performance.
- C. Improve the quality of care.
- D. limit privileges of at-risk providers.
Answer:
C
Explanation:
According to the National Association for Healthcare Quality (NAHQ), peer review is a quality control
measure for medical research and practice, in which professionals review each other’s work to
ensure that it is accurate, relevant, and significant12.
The overall purpose of peer review is to improve the quality of care by enhancing the scientific
validity, transparency, and integrity of published research, as well as the clinical performance, safety,
and outcomes of healthcare providers1234.
Among the four options given, the best answer is C. Improve the quality of care, because this is the
ultimate goal and benefit of peer review, regardless of the specific methods, metrics, or settings
involved1234.
The other options are less accurate because:
A. Evaluate process improvement initiatives is a possible outcome of peer review, but not the desired
one. Peer review can help assess the effectiveness, efficiency, and sustainability of process
improvement initiatives, but the aim is not to evaluate them for their own sake, but to improve the
quality of care for patients125.
B. Compare provider performance is a possible outcome of peer review, but not the desired
one. Peer review can help compare provider performance against established standards,
benchmarks, or best practices, but the aim is not to rank or judge them, but to identify areas of
strength and weakness, and to provide feedback and support for improvement126.
D. Limit privileges of at-risk providers is a possible outcome of peer review, but not the desired
one. Peer review can help identify and address at-risk providers who may pose a threat to patient
safety or quality of care, but the aim is not to punish or exclude them, but to protect patients and to
help providers remediate their performance or behavior127. Reference: 1: [Peer review: What is it
and why do we do it?] 2: [Peer Review Matters: Research Quality and the Public Trust] 3: [Peer review
of qualityof care: methods and metrics] 4: [What is the purpose of peer review in health care?] 5:
[Utilization of Improvement Methodologies by Healthcare Quality Professionals During the COVID-19
Pandemic] 6: [Shaping the Future of the Healthcare Quality Profession] 7: [Understanding the
Evolving Landscape of Healthcare Quality] : https://www.medicalnewstoday.com/articles/281528 :
https://pubs.asahq.org/anesthesiology/article/134/1/1/114542/Peer-Review-Matters-Research-
Quality-and-the : https://qualitysafety.bmj.com/content/32/1/1 : https://www.mlsgroupllc.com/mls-
blog/what-is-the-purpose-of-peer-review-in-health-care : https://nahq.org/resources/journal
Comments
Question 9
A root cause analysts (RCA) was conducted tor an event related to a delayed high-priority alarm
response. Alarm fatigue was determined to be a root cause. Which of the following Is the most
appropriate first Intervention?
- A. Establish a written policy for alarms escalation.
- B. Review alarm signals for clinical appropriateness.
- C. Implement a guideline with clear criteria for Initiation of cardiac monitoring.
Answer:
B
Explanation:
A root cause analysis (RCA) is asystematic process of identifying the factors that contributed to an
adverse event or near miss in order to prevent recurrence and improve patient safety1.
Alarm fatigue is a condition in which clinicians become desensitized to the numerous alerts and
warnings generated by medical devices, leading to longer response times or missed alarms2.
Alarm fatigue can compromise patient safety by increasing the risk of adverse events, such as
delayed treatment, missed diagnosis, or cardiac arrest3.
To reduce alarm fatigue, the Joint Commission recommends a four-step approach: establish alarm
system management as a priority; identify the most important alarms to manage; establish policies
and procedures for alarm system management; and educate staff and patients about alarm system
management4.
The most appropriate first intervention for an event related to a delayed high-priority alarm response
is to review alarm signals for clinical appropriateness. This means to evaluate the alarm settings,
limits, and delays for each device and patient population, and adjust them according to evidence-
based guidelines and best practices5. This can help reduce the number of false or clinically
insignificant alarms, and improve the specificity and sensitivity of the alarm system.
Establishing a written policy for alarm escalation is also an important intervention, but it is not the
first step. A policy for alarm escalation should define the roles and responsibilities of staff, the criteria
and process for escalating alarms, and the expected response time and actions for each alarm level.
However, before developing such a policy, it is necessary to review the alarm signals and ensure that
they are clinically relevant and meaningful.
Implementing a guideline with clear criteria for initiation of cardiac monitoring is another
intervention that can reduce alarm fatigue, but it is not the first step either. A guideline for cardiac
monitoring should specify the indications, duration, and discontinuation of continuous
electrocardiographic (ECG) monitoring for patients at risk of cardiac arrhythmias or
ischemia. However, before implementing such a guideline, it is necessary to review the alarm signals
and ensure that they are appropriate forthe patient population and clinical
setting. Reference: 1: NAHQ Code of Ethics 2: Reducing the Safety Hazards of Monitor Alert and
Alarm Fatigue 3: Alarm fatigue: impacts on patient safety 4: The Joint Commission National Patient
Safety Goal on clinical alarm safety 5: Alarm Management: Advancing From Failure Cause To Root
Cause Analysis : [Utilization of Improvement Methodologies by Healthcare Quality Professionals
During the COVID-19 Pandemic] : [The Financial Case for Quality as a Business Strategy] : [Shaping
the Future of the Healthcare Quality Profession] : [Practice Standards for Electrocardiographic
Monitoring in Hospital Settings] : [Understanding the Evolving Landscape of Healthcare Quality]
Comments
Question 10
Establishing a culture of safety begins with having the right
- A. recruitment strategies.
- B. plan.
- C. leadership.
- D. educational programs.
Answer:
C
Explanation:
A culture of safety in healthcare is the extent to which an organization’s culture supports and
promotes patient safety1. It refers to the values, beliefs, and norms that are shared byhealthcare
practitioners and other staff throughout the organization that influence their actions and behaviors2.
A culture of safety requires a collaborative and data-driven approach that involves multiple
stakeholders, such as clinicians, managers, patients, and quality professionals3. It also requires a
commitment to continuous improvement, learning from errors, and addressing system-level factors
that contribute to patient harm.
According to the National Association for Healthcare Quality (NAHQ), one of the core competencies
for healthcare quality professionals is to lead and facilitate change initiatives that align with the
organization’s strategic goals and priorities. NAHQ also states that healthcare quality professionals
should advocate for a culture of safety and quality across the organization.
Therefore, the option that best reflects the first step in establishing a culture of safety is C.
leadership. Leadership is essential for creating a vision, setting expectations, providing resources,
and empowering staff to participate in safety improvement efforts. Leadership also influences the
organizational climate, which affects the attitudes and behaviors of staff towards patient safety.
The other options are less likely to be the first step in establishing a culture of safety, as they are
either too specific, too vague, or too dependent on other factors. For example, recruitment
strategies, plan, and educational programs are important components of a culture of safety, but they
are not sufficient or effective without strong and supportive leadership . Reference:
1: Safety Culture in Healthcare: A 7-Step Framework
2: What Is Patient Safety Culture?
3: 9 Effective Performance Management Strategies for Healthcare
A Guide to Performance Improvement in Healthcare
Healthcare Quality Solutions: Ready Your Workforce for Quality
Code of Ethics
Safety Culture in Healthcare Settings
Understanding the Evolving Landscape of Healthcare Quality
Comments
Page 1 out of 60
Viewing questions 1-10 out of 603
page 2