Question 1
Why must you wait for several minutes before you run a playbook that you just created?
- A. FortiAnalyzer needs that time to parse the new playbook.
- B. FortiAnalyzer needs that time to debug the new playbook.
- C. FortiAnalyzer needs that time to back up the current playbooks.
- D. FortiAnalyzer needs that time to ensure there are no other playbooks running.
Answer:
A
Explanation:
When a new playbook is created on FortiAnalyzer, the system requires some time to parse and
validate the playbook before it can be executed. Parsing involves checking the playbook's structure,
ensuring that all syntax and logic are correct, and preparing the playbook for execution within
FortiAnalyzer’s automation engine. This initial parsing step is necessary for FortiAnalyzer to load the
playbook into its operational environment correctly.
Here’s why the other options are incorrect:
Option A: FortiAnalyzer needs that time to parse the new playbook
This is correct. The delay is due to the parsing and setup process required to prepare the new
playbook for execution. FortiAnalyzer’s automation engine checks for any issues or dependencies
within the playbook, ensuring that it can run without errors.
Option B: FortiAnalyzer needs that time to debug the new playbook
This is incorrect. Debugging is not an automatic process that FortiAnalyzer undertakes after playbook
creation. Debugging, if necessary, is a manual task performed by the administrator if there are issues
with the playbook execution.
Option C: FortiAnalyzer needs that time to back up the current playbooks
This is incorrect. FortiAnalyzer does not automatically back up playbooks every time a new one is
created. Backups of configuration and playbooks are typically scheduled as part of routine
maintenance and are not triggered by playbook creation.
Option D: FortiAnalyzer needs that time to ensure there are no other playbooks running
This is incorrect. FortiAnalyzer can manage multiple playbooks running simultaneously, so it does not
require waiting for other playbooks to finish before initiating a new one. The waiting time specifically
relates to the parsing process of the newly created playbook.
Reference: FortiAnalyzer documentation states that after creating a playbook, a brief delay is
expected as the system parses and validates the playbook. This ensures that any syntax errors or
logical inconsistencies are resolved before the playbook is executed, making option A the correct
answer.
Comments
Question 2
Exhibit.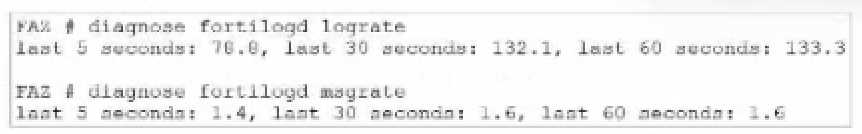
What can you conclude about the output?
- A. The message rate being lower that the log rate is normal.
- B. Both messages and logs are almost finished indexing.
- C. There are more traffic logs than event logs.
- D. The output is ADOM specific
Answer:
A
Explanation:
In this output, we see two diagnostic commands executed on a FortiAnalyzer device:
diagnose fortilogd lograte: This command shows the rate at which logs are being processed by the
FortiAnalyzer in terms of log entries per second.
diagnose fortilogd msgrate: This command displays the message rate, or the rate at which individual
messages are being processed.
The values provided in the exhibit output show:
Log rate (lograte): Consistently high, showing values such as 70.0, 132.1, and 133.3 logs per second
over different time intervals.
Message rate (msgrate): Lower values, around 1.4 to 1.6 messages per second.
Explanation
Interpretation of log rate vs. message rate: In FortiAnalyzer, the log rate typically refers to the rate of
logs being stored or indexed, while the message rate refers to individual messages within these logs.
Given that a single log entry can contain multiple messages, it's common to see a lower message
rate relative to the log rate.
Understanding normal operation: In this case, the message rate being lower than the log rate is
expected and typical behavior. This discrepancy can arise because each log entry may bundle
multiple related messages, reducing the message rate relative to the log rate.
Conclusion
Correct Answe r : A. The message rate being lower than the log rate is normal.
This aligns with the normal operational behavior of FortiAnalyzer in processing logs and messages.
There is no indication that both logs and messages are nearly finished indexing, as that would
typically show diminishing rates toward zero, which is not the case here. Additionally, there’s no
information in this output about specific ADOMs or a comparison between traffic logs and event
logs. Thus, options B, C, and D are incorrect.
Reference:
FortiOS 7.4.1 and FortiAnalyzer 7.4.1 command guides for diagnose fortilogd lograte and diagnose
fortilogd msgrate.
Comments
Question 3
Exhibit.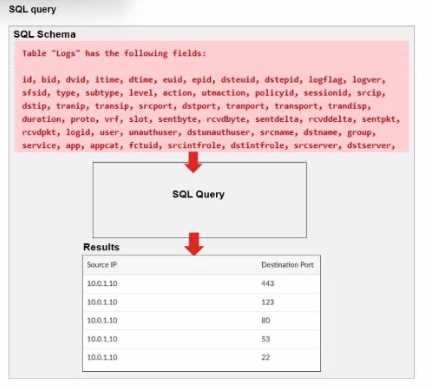
A fortiAnalyzer analyst is customizing a SQL query to use in a report.
Which SQL query should the analyst run to get the expected results?
A)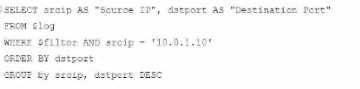
B)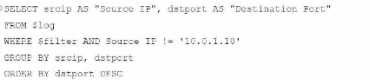
C)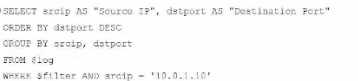
D)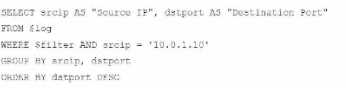
- A. Option A
- B. Option B
- C. Option C
- D. Option D
Answer:
A
Explanation:
The requirement here is to construct a SQL query that retrieves logs with specific fields, namely
"Source IP" and "Destination Port," for entries where the source IP address matches 10.0.1.10. The
correct syntax is essential for selecting, filtering, ordering, and grouping the results as shown in the
expected outcome.
Analysis of the Options:
Option A Explanation:
SELECT srcip AS "Source IP", dstport AS "Destination Port": This syntax selects srcip and dstport,
renaming them to "Source IP" and "Destination Port" respectively in the output.
FROM $log: Specifies the log table as the data source.
WHERE $filter AND srcip = '10.0.1.10': This line filters logs to only include entries with srcip equal to
10.0.1.10.
ORDER BY dstport DESC: Orders the results in descending order by dstport.
GROUP BY srcip, dstport: Groups results by srcip and dstport, which is valid SQL syntax.
This option meets all the requirements to get the expected results accurately.
Option B Explanation:
WHERE $filter AND Source IP != '10.0.1.10': Uses != instead of =. This would exclude logs from the
specified IP 10.0.1.10, which is contrary to the expected result.
Option C Explanation:
The ORDER BY clause appears before the FROM clause, which is incorrect syntax. SQL requires the
FROM clause to follow the SELECT clause directly.
Option D Explanation:
The GROUP BY clause should follow the FROM clause. However, here, it’s located after WHERE,
making it syntactically incorrect.
Conclusion:
Correct Answe r : A. Option A
This option aligns perfectly with standard SQL syntax and filters correctly for srcip = '10.0.1.10', while
ordering and grouping as required.
Reference:
FortiAnalyzer 7.4.1 SQL query capabilities and syntax for report customization.
Comments
Question 4
Exhibit.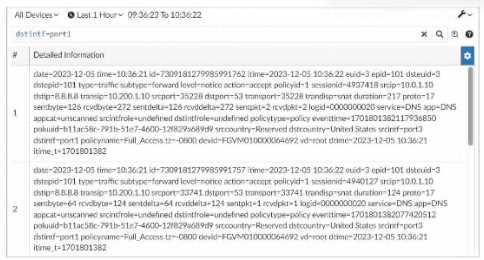
What can you conclude about these search results? (Choose two.)
- A. They can be downloaded to a file.
- B. They are sortable by columns and customizable.
- C. They are not available for analysis in FortiView.
- D. They were searched by using text mode.
Answer:
A, D
Explanation:
In this exhibit, we observe a search query on the FortiAnalyzer interface displaying log data with
details about the connection events, including fields like date, srcip, dstip, service, and dstintf. This
setup allows for several functionalities within FortiAnalyzer.
Explanation:
Option A - Download Capability:
FortiAnalyzer provides the option to download search results and reports to a file in multiple
formats, such as CSV or PDF, allowing for further offline analysis or archival. This makes it possible to
save the search results shown in the exhibit to a file.
Conclusion: Correct.
Option B - Sorting and Customization:
The FortiAnalyzer interface allows users to sort and customize columns for search results. This helps
in organizing and viewing the logs in a manner that fits the analyst's needs, such as ordering logs by
time, srcip, dstip, or other fields.
Conclusion: Correct.
Option C - Availability in FortiView:
FortiView is a tool within FortiAnalyzer that visualizes data and provides analysis capabilities,
including traffic and security event logs. Since these are traffic logs, they are typically available for
visualization and analysis within FortiView.
Conclusion: Incorrect.
Option D - Text Mode Search:
The search displayed here appears to be in a structured format, which implies it might be utilizing
filters rather than a free-text search. FortiAnalyzer allows both structured searches and text searches,
but there's no indication here that text mode was used.
Conclusion: Incorrect.
Conclusion:
Correct Answe r : A. They can be downloaded to a file. and B. They are sortable by columns and
customizable.
These options are consistent with FortiAnalyzer's capabilities for managing, exporting, and
customizing log data.
Reference:
FortiAnalyzer 7.4.1 documentation on search, export functionalities, and customizable views.
Comments
Question 5
Which two methods can you use to send notifications when an event occurs that matches a
configured event handler? (Choose two.)
- A. Send Alert through Fabric Connectors
- B. Send SNMP trap
- C. Send SMS notification
- D. Send Alert through FortiSIEM MEA
Answer:
BC
Explanation:
In FortiAnalyzer, event handlers can be configured to trigger specific notifications when an event
matches defined criteria. These notifications are designed to alert administrators in real time about
critical events.
Explanation:
Option B - Send SNMP Trap:
FortiAnalyzer supports sending SNMP traps as one of the notification methods when an event
matches an event handler. This allows integration with SNMP-enabled network management
systems, which can then trigger further alerts or actions based on the trap received.
Conclusion: Correct.
Option C - Send SMS Notification:
FortiAnalyzer also supports SMS notifications, enabling alerts to be sent via SMS to predefined
recipients. This method is useful for administrators who require immediate alerts but may not have
access to email or other notification systems at all times.
Conclusion: Correct.
Option A - Send Alert through Fabric Connectors:
While Fabric Connectors allow FortiAnalyzer to interact with other parts of the Security Fabric, they
are primarily used for data sharing and automation rather than directly for sending alerts or
notifications.
Conclusion: Incorrect.
Option D - Send Alert through FortiSIEM MEA:
FortiSIEM integration allows for data sharing and further analysis within the Fortinet ecosystem, but
it does not directly act as a notification method from FortiAnalyzer itself.
Conclusion: Incorrect.
Conclusion:
Correct Answe r : B. Send SNMP trap and C. Send SMS notification
These options represent valid notification methods for FortiAnalyzer’s event handler configuration.
Reference:
FortiAnalyzer 7.4.1 documentation on event handler configuration and available notification
methods.
Comments
Question 6
Exhibit.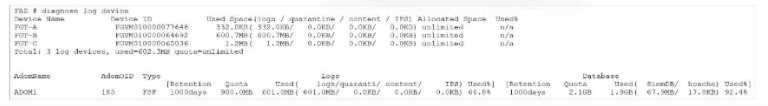
What can you conclude from this output?
- A. There is not disk quota allocated to quarantining files.
- B. FGT_B is the Security Fabric root.
- C. The allocated disk quote to ADOM1 is 3 GB.
- D. Archive logs are using more space than analytic logs.
Answer:
C
Explanation:
The exhibit displays a diagnose log device output on a FortiAnalyzer, showing details about disk
space usage and quotas for different FortiGate devices and ADOMs (Administrative Domains). Here’s
a breakdown of key details:
Disk Quota for Quarantined Files:
The output includes columns labeled for used space in categories such as "logs," "quarantine,"
"content," and "DB." For each device, the quarantine column consistently shows 0.0KB used,
indicating that there is no disk quota allocated or utilized for quarantining files.
Conclusion: Correct.
FGT_B as Security Fabric Root:
There is no direct indication from this output that specifies FGT_B is the root of the Security Fabric.
Information on Security Fabric topology or root designation would typically come from a Security
Fabric configuration command rather than a disk usage summary.
Conclusion: Incorrect.
Allocated Disk Quota for ADOM1:
The output shows the quota for ADOM1 is "unlimited," not a fixed 3 GB quota. Therefore, there is no
set 3 GB limit for ADOM1.
Conclusion: Incorrect.
Comparison of Archive Logs and Analytic Logs:
The output does not differentiate between archive logs and analytic logs; it only shows overall disk
usage by type (e.g., logs, quarantine). Therefore, no conclusion can be made about which type of
logs (archive or analytic) is using more space.
Conclusion: Incorrect.
Conclusion:
Correct Answe r : A. There is no disk quota allocated to quarantining files.
This answer aligns with the observed data, where no disk space is used or allocated for quarantine
files.
Reference:
FortiAnalyzer 7.4.1 documentation on diagnose log device command usage and disk quota settings.
Comments
Question 7
Exhibit.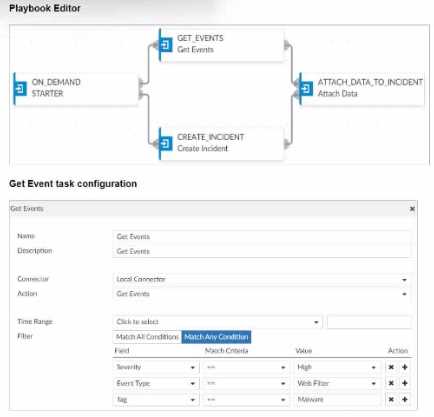
Assume these are all the events that exist on the FortiAnalyzer device.
How many events will be added to the incident created after running this playbook?
- A. Eleven events will be added.
- B. Seven events will be added
- C. No events will be added.
- D. Four events will be added.
Answer:
D
Explanation:
In the exhibit, we see a playbook in FortiAnalyzer designed to retrieve events based on specific
criteria, create an incident, and attach relevant data to that incident. The "Get Event" task
configuration specifies filters to match any of the following conditions:
Severity = High
Event Type = Web Filter
Tag = Malware
Analysis of Events:
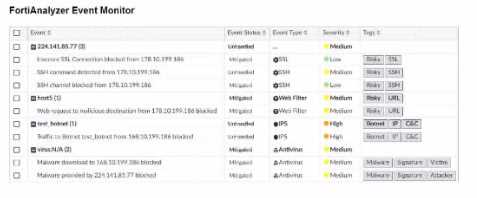
In the FortiAnalyzer Event Monitor list:
We need to identify events that meet any one of the specified conditions (since the filter is set to
"Match Any Condition").
Events Matching Criteria:
Severity = High:
There are two events with "High" severity, both with the "Event Type" IPS.
Event Type = Web Filter:
There are two events with the "Event Type" Web Filter. One has a "Medium" severity, and the other
has a "Low" severity.
Tag = Malware:
There are two events tagged with "Malware," both with the "Event Type" Antivirus and "Medium"
severity.
After filtering based on these criteria, there are four distinct events:
Two from the "Severity = High" filter.
One from the "Event Type = Web Filter" filter.
One from the "Tag = Malware" filter.
Conclusion:
Correct Answe r : D. Four events will be added.
This answer matches the conditions set in the playbook filter configuration and the events listed in
the Event Monitor.
Reference:
FortiAnalyzer 7.4.1 documentation on event filtering, playbook configuration, and incident
management criteria.
Comments
Question 8
Which statement about SQL SELECT queries is true?
- A. They can be used to purge log entries from the database.
- B. They must be followed immediately by a WHERE clause.
- C. They can be used to display the database schema.
- D. They are not used in macros.
Answer:
D
Explanation:
Option A - Purging Log Entries:
A SELECT query in SQL is used to retrieve data from a database and does not have the capability to
delete or purge log entries. Purging logs typically requires a DELETE or TRUNCATE command.
Conclusion: Incorrect.
Option B - WHERE Clause Requirement:
In SQL, a SELECT query does not require a WHERE clause. The WHERE clause is optional and is used
only when filtering results. A SELECT query can be executed without it, meaning this statement is
false.
Conclusion: Incorrect.
Option C - Displaying Database Schema:
A SELECT query retrieves data from specified tables, but it is not used to display the structure or
schema of the database. Commands like DESCRIBE, SHOW TABLES, or SHOW COLUMNS are typically
used to view schema information.
Conclusion: Incorrect.
Option D - Usage in Macros:
FortiAnalyzer and similar systems often use macros for automated functions or specific query-based
tasks. SELECT queries are typically not included in macros because macros focus on procedural or
repetitive actions, rather than simple data retrieval.
Conclusion: Correct.
Conclusion:
Correct Answe r : D. They are not used in macros.
This aligns with typical SQL usage and the specific functionalities of FortiAnalyzer.
Reference:
FortiAnalyzer 7.4.1 documentation on SQL queries, database operations, and macro usage.
Comments
Question 9
Exhibit.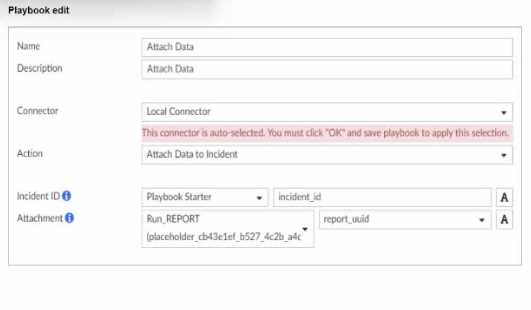
What is the analyst trying to create?
- A. The analyst is trying to create a trigger variable to the used in the playbook.
- B. The analyst is trying to create an output variable to be used in the playbook.
- C. The analyst is trying to create a report in the playbook.
- D. The analyst is trying to create a SOC report in the playbook.
Answer:
B
Explanation:
In the exhibit, the playbook configuration shows the analyst working with the "Attach Data" action
within a playbook. Here’s a breakdown of key aspects:
Incident ID: This field is linked to the "Playbook Starter," which indicates that the playbook will attach
data to an existing incident.
Attachment: The analyst is configuring an attachment by selecting Run_REPORT with a placeholder
ID for report_uuid. This suggests that the report’s UUID will dynamically populate as part of the
playbook execution.
Analysis of Options:
Option A - Creating a Trigger Variable:
A trigger variable would typically be set up in the playbook starter or initiation configuration, not
within the "Attach Data" action. The setup here does not indicate a trigger, as it’s focusing on data
attachment.
Conclusion: Incorrect.
Option B - Creating an Output Variable:
The field Attachment with a report_uuid placeholder suggests that the analyst is defining an output
variable that will store the report data or ID, allowing it to be attached to the incident. This variable
can then be referenced or passed within the playbook for further actions or reporting.
Conclusion: Correct.
Option C - Creating a Report in the Playbook:
While Run_REPORT is selected, it appears to be an attachment action rather than a report generation
task. The purpose here is to attach an existing or dynamically generated report to an incident, not to
create the report itself.
Conclusion: Incorrect.
Option D - Creating a SOC Report:
Similarly, this configuration is focused on attaching data, not specifically generating a SOC report.
SOC reports are generally predefined and generated outside the playbook.
Conclusion: Incorrect.
Conclusion:
Correct Answe r : B. The analyst is trying to create an output variable to be used in the playbook.
The setup allows the playbook to dynamically assign the report_uuid as an output variable, which
can then be used in further actions within the playbook.
Reference:
FortiAnalyzer 7.4.1 documentation on playbook configurations, output variables, and data
attachment functionalities.
Comments
Question 10
Which FortiAnalyzer feature allows you to use a proactive approach when managing your network
security?
- A. FortiView Monitor
- B. Outbreak alert services
- C. Incidents dashboard
- D. Threat hunting
Answer:
D
Explanation:
FortiAnalyzer offers several features for monitoring, alerting, and incident management, each
serving different purposes. Let's examine each option to determine which one best supports a
proactive security approach.
Option A - FortiView Monitor:
FortiView is a visualization tool that provides real-time and historical insights into network traffic,
threats, and logs. While it gives visibility into network activity, it is generally more reactive than
proactive, as it relies on existing log data and incidents.
Conclusion: Incorrect.
Option B - Outbreak Alert Services:
Outbreak Alert Services in FortiAnalyzer notify administrators of emerging threats and outbreaks
based on FortiGuard intelligence. This is beneficial for awareness of potential threats but does not
offer a hands-on, investigative approach. It’s more of a notification service rather than an active,
proactive investigation tool.
Conclusion: Incorrect.
Option C - Incidents Dashboard:
The Incidents Dashboard provides a summary of incidents and current security statuses within the
network. While it assists with ongoing incident response, it is used to manage and track existing
incidents rather than proactively identifying new threats.
Conclusion: Incorrect.
Option D - Threat Hunting:
Threat Hunting in FortiAnalyzer enables security analysts to actively search for hidden threats or
malicious activities within the network by leveraging historical data, analytics, and intelligence. This
is a proactive approach as it allows analysts to seek out threats before they escalate into incidents.
Conclusion: Correct.
Conclusion:
Correct Answe r : D. Threat hunting
Threat hunting is the most proactive feature among the options, as it involves actively searching for
threats within the network rather than reacting to already detected incidents.
Reference:
FortiAnalyzer 7.4.1 documentation on Threat Hunting and proactive security measures.
Comments
Page 1 out of 5
Viewing questions 1-10 out of 56
page 2